Analytics and reports
An "Analytics and reports" view will help you to compose interactive charts and reports on the training process.
Any user of Staminity can analyze his own data and coach with enabled "Coach" tariff plan - his athletes' data.
View reports
In order to proceed to the view, you should click on the "Analytics and reports" item in the menu to the left.
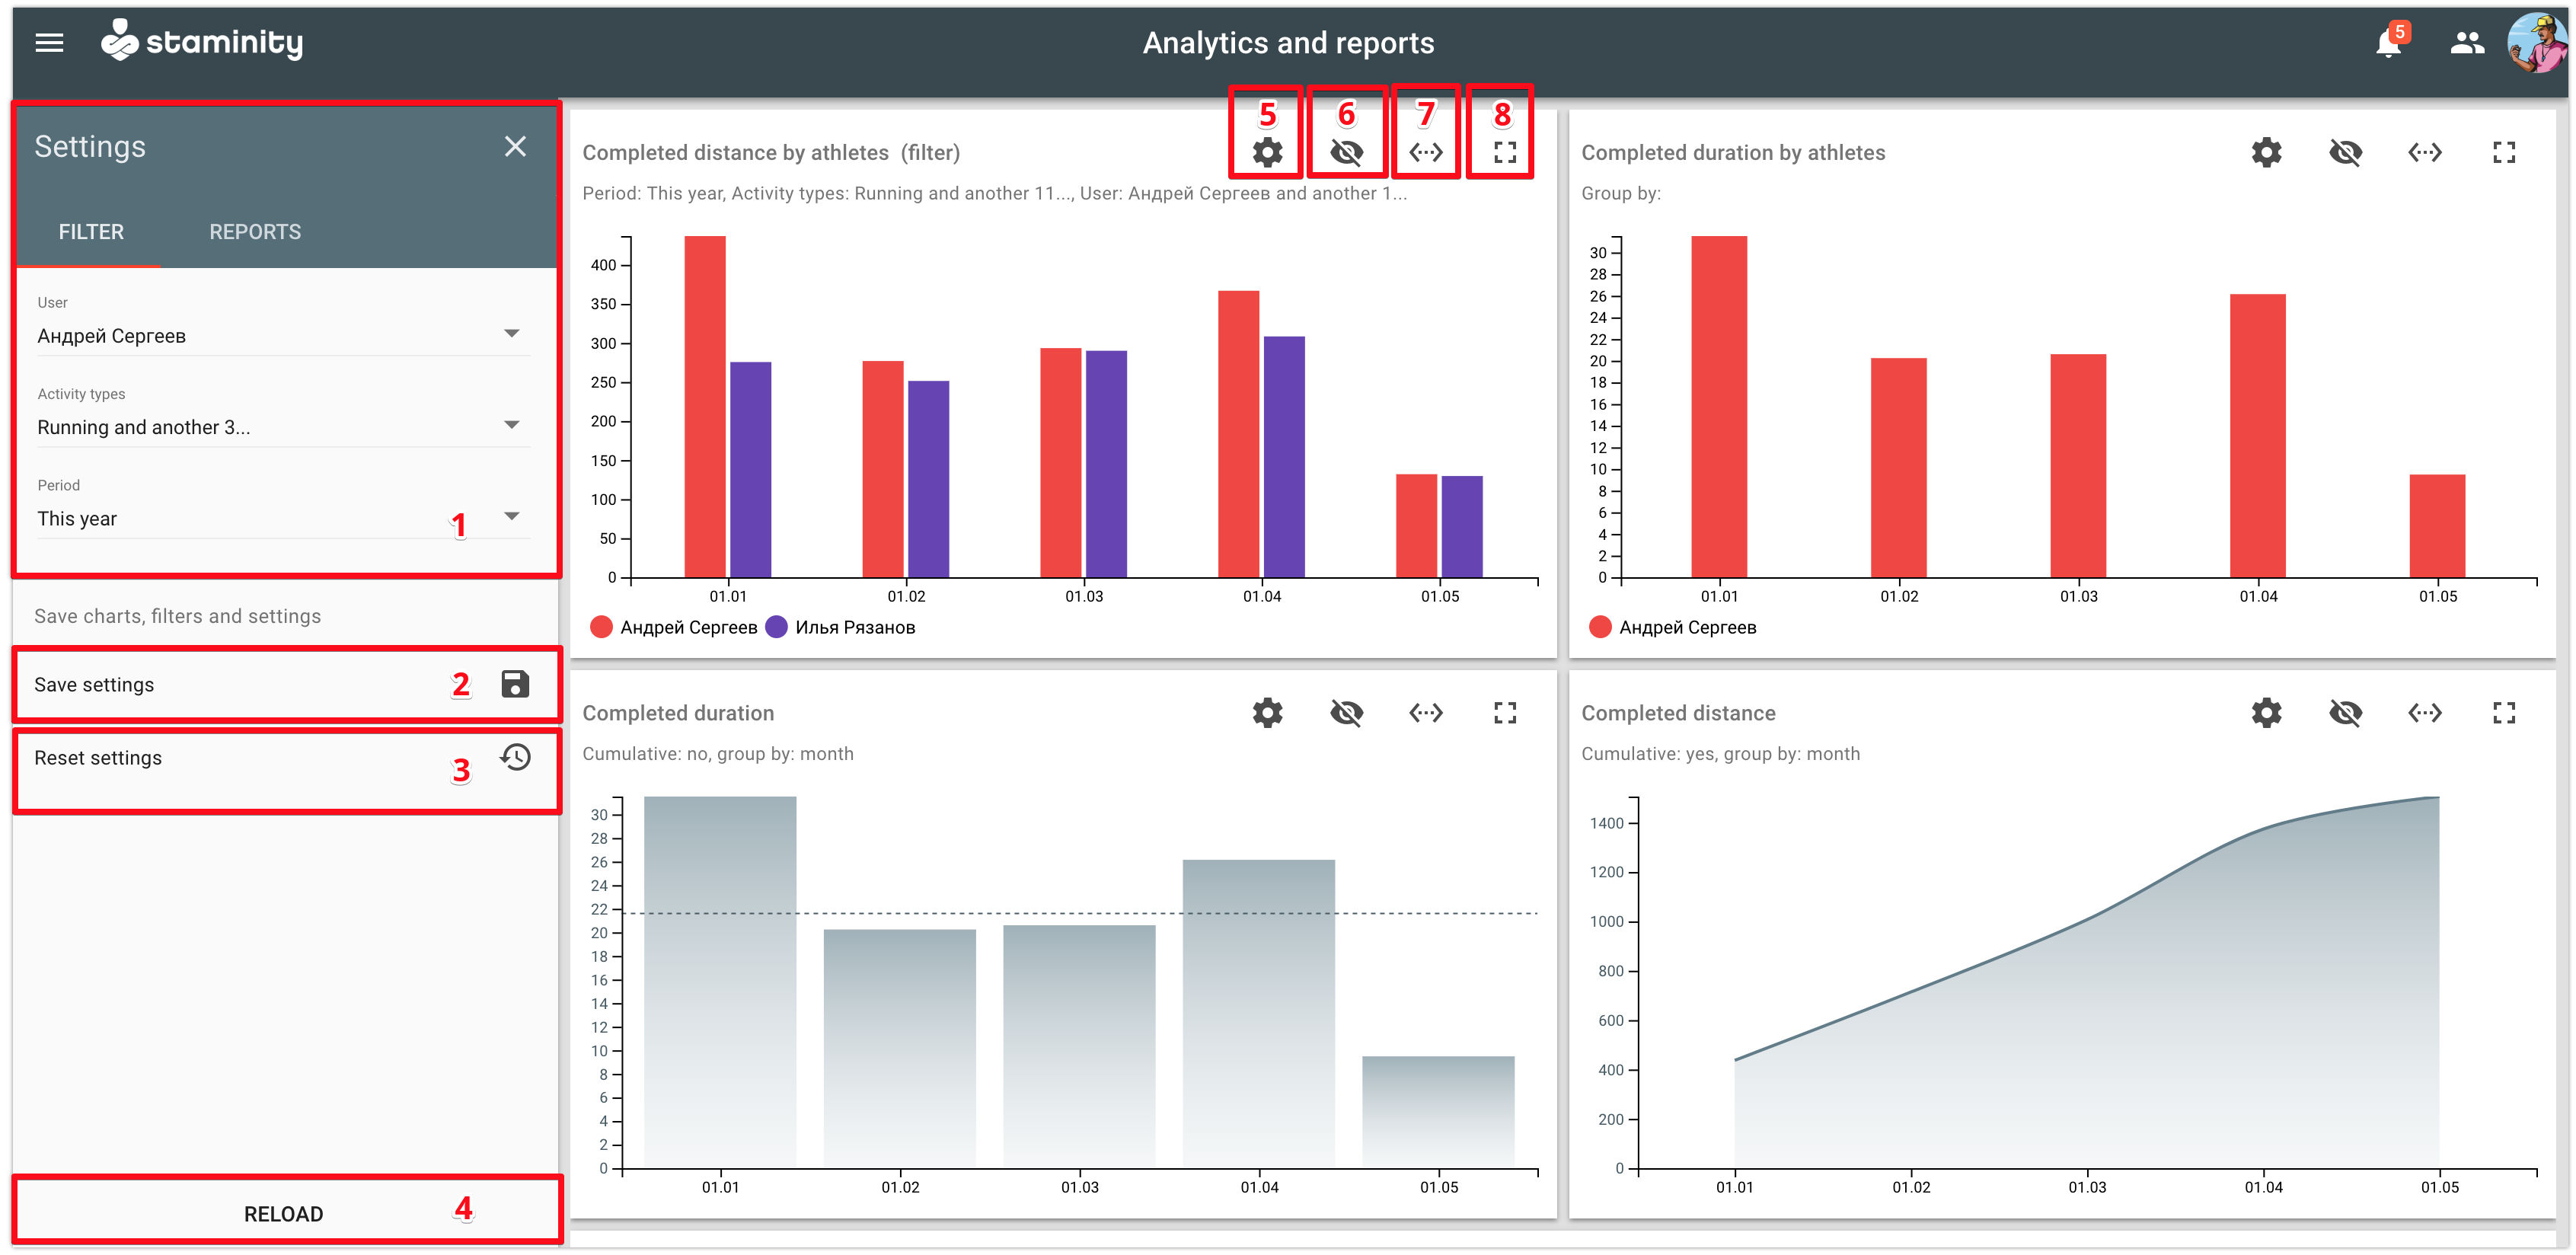
Structure of the "Analytics and reports" view:
1 - Panel of general params and charts. Each chart is composed either on the basis of general params or local params. By default, all charts use general params. If you want to change the params for a specific chart, you can do it in the chart's settings [5].
2 - Save general settings. When you click on “Save settings”, the system saves the set filters and layout and applies them to all charts when you reopen the view.
Tip.
You can set the required layout, params and filters only once and save settings. After that, when you proceed to the “Analytics and reports” view, you will see only the needed information.
- 3 - Reset settings. Return to the default chart settings.
4 - “Refresh” button. Click on “Refresh” and all charts will be composed based on the new params, set in [1].
5 - 8 - Params of a separate chart:
- 5 - Go to settings;
- 6 - Hide chart;
- 7 - Expand the chart to the full width of the screen;
- 8 - Expand the chart to full screen.
Add the required charts
In order to change the list of the available charts displayed in the main panel, go to the “Reports” tab in the left panel: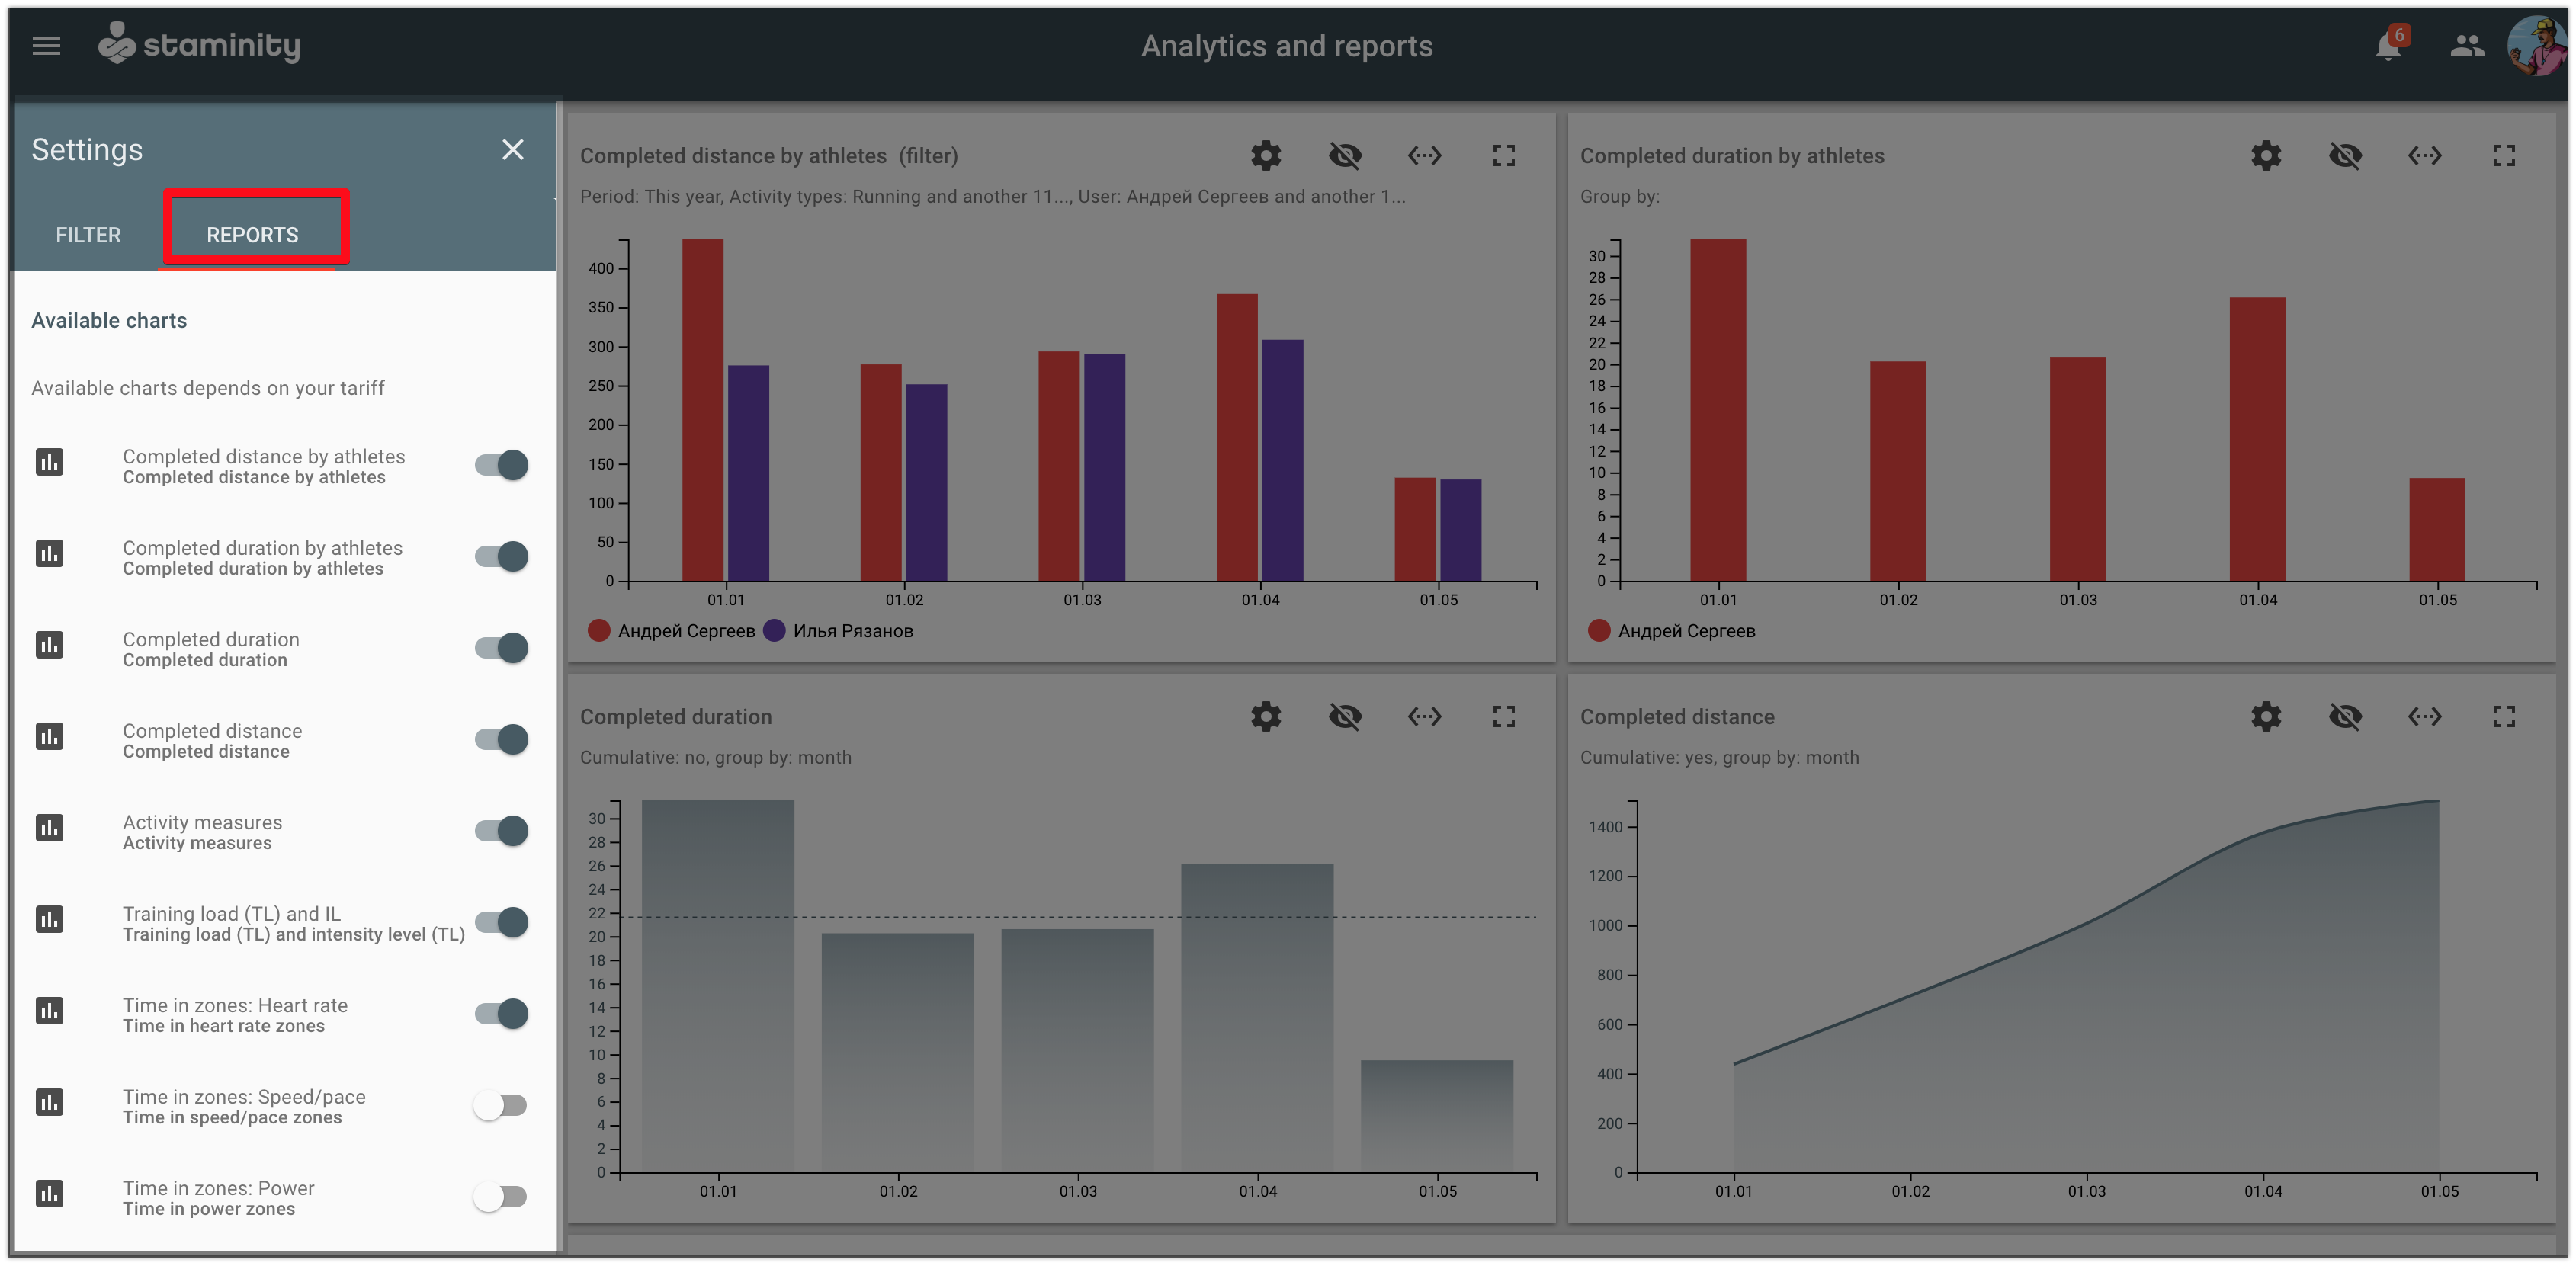
Set the display attribute to the “Turned on” mode for the required reports, and to the “Turned off” mode for the ones you want to hide.
Change settings of a specific chart
Each chart has its own settings. In order to change them, click on the “Settings” button located on the chart (button [5] on the image above).
The following parameters are available in the chart settings window:
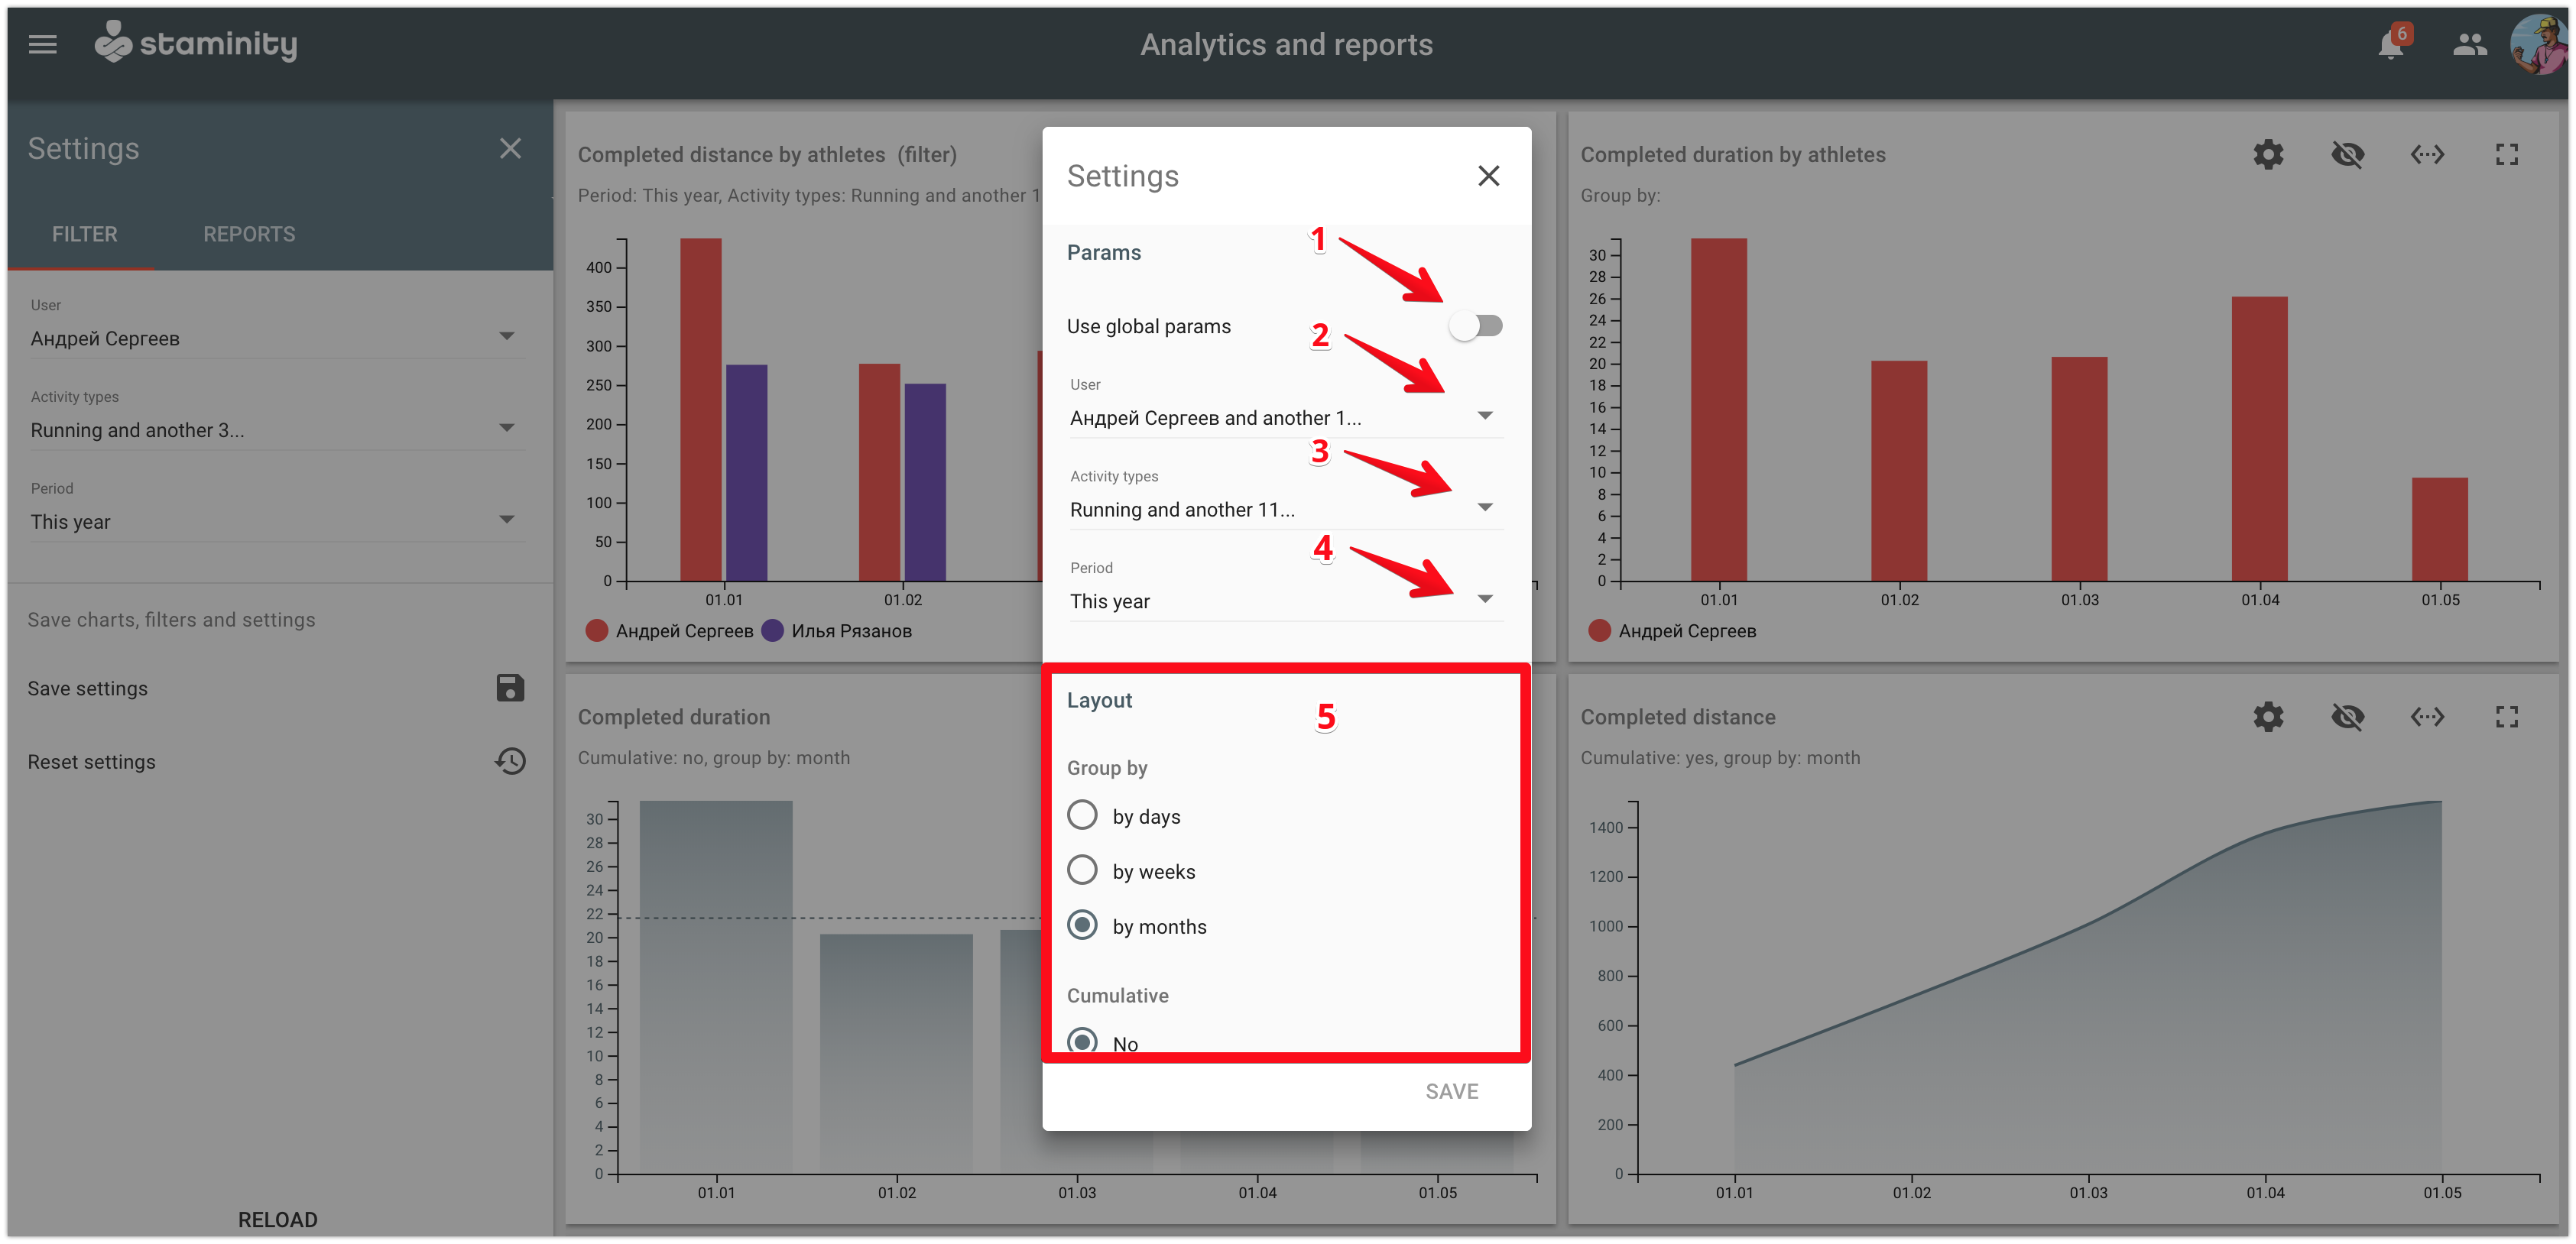
1 - Attribute "Use general params". In case if it is “Turned on” then the chart will be composed based on the general params (panel [1] on the first image), and if it is “Turned off” - on the local parameters.
2 - 4 - Local params of the chart:
- 2 - Users. A coach can select several athletes to compare;
- 3 - Activity types. Reports will be provided only for the set activity types;
- 4 - Period. Select a reporting period.
5 - Layout of the chart. Depends on the specific chart and offers the user to select the data grouping mode, the list of displayed indicators, etc.
In order to display the chart according to the new params, click on the “Save” button.