
Activity: complete and analyze
An activity becomes completed when it gets actual data. There are three ways to mark an activity as completed:
- Automatically after uploading the completed activity;
- By setting actual values manually;
- By merging actual and planned activities.
A completed activity uploaded from a sports watch, a smartphone or another service has the following analysis tools:
- Activity tabs;
- Comparing planned and actual values - “Overview” tab;
- Indicators chart;
- Calculated indicators - “Details” tab;
- Peaks by time and by distance - “Details” tab;
- Laps;
- Time in zones;
- Analysis of a structured activity by segments.
How to mark an activity as completed
Automatic upload of completed activities
It is a recommended mode. You can set up automatic synchronization of activities and all the activities recorded by your sports watch or by an application on your smartphone will be uploaded to Staminity and matched with the planned ones.
The rules of activities’ matching:
- each completed activity that is uploaded to Staminity is compared with all planned activities of the day;
- if the given activity more accurately corresponds to a plan and this planned activity already has a merged completed activity, then the new completed activity ousts the previous one and merges with the plan.
For example, you had a half-marathon planned for today and at first you ran 2 km as a warm-up and then you ran 21 km. The warm-up will be the first one to be uploaded to Staminity and it will be matched with the plan. But the moment the completed half-marathon activity is uploaded, everything will fall into place: the planned half-marathon will be matched to the completed one, and the warm-up will be displayed separately, without a plan.
Set actual values manually
The actual values can be set manually. This option comes in handy if you have completed a strength training without recording a track, if you have forgotten to start the application on your smartphone or if your watch battery has run low.
In order to set actual values manually:
- Open the activity in the calendar and click “Edit” at the bottom of the activity window.
- Click “Add actual data” (1). If actual data is already entered, the button is called “Edit actual data”.
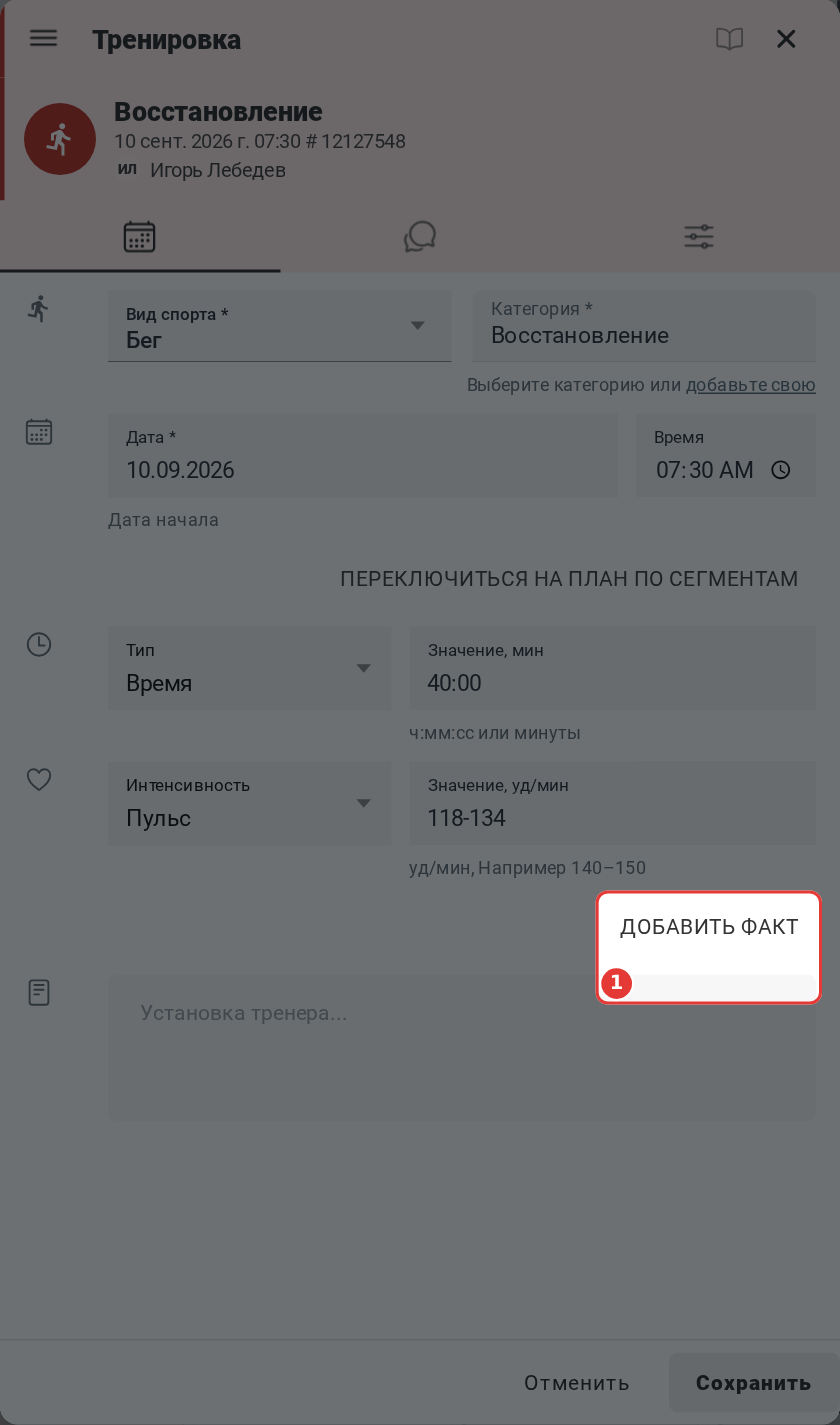
- In the “Actual data” window, fill in the duration or distance and, optionally, the intensity: heart rate, pace or speed, power. Under a field that has a plan, the planned value is shown.
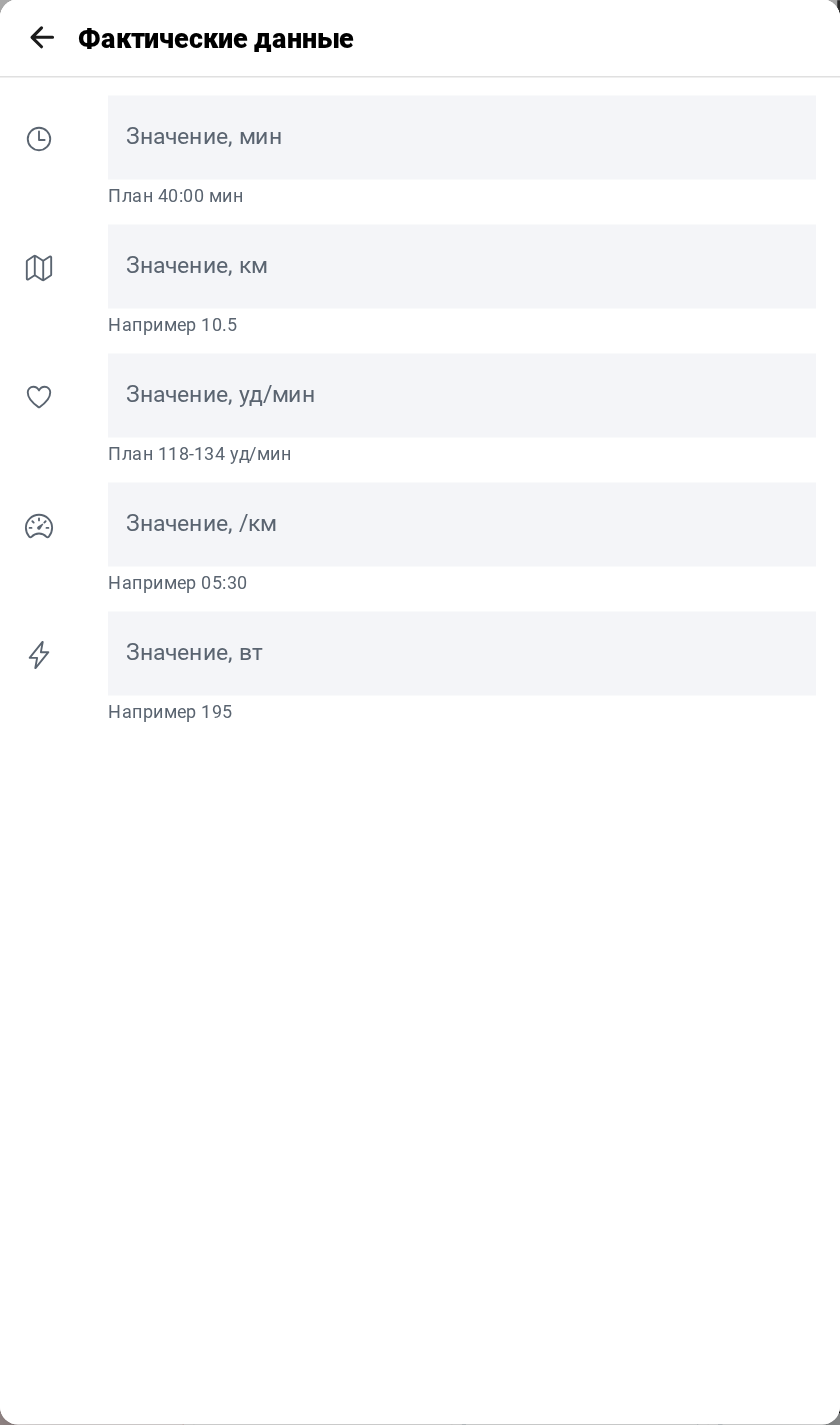
- Go back to the activity with the “Back” arrow and click “Save”. The actual data is saved together with the activity - without “Save” it is not stored.
Your coach will receive a notification about the completed activity. A comment for the coach can be left in the activity chat.
Please note:
- actual data is entered manually into an existing activity. If the activity was not planned, first create it on the required day and then add the actual data;
- actual data can be entered manually only in a simple activity. A structured activity, with a plan by segments, has no such button, and a simple activity with manually entered actual data cannot be switched to a plan by segments;
- if the actual data was uploaded from a watch or another service, the “Actual data” window only shows it - it cannot be changed.
Merge completed activity with planned one
If the planned and completed activities have been matched incorrectly, at first you need to split the activity into planned and completed and then merge the completed activity with the corresponding planned one.
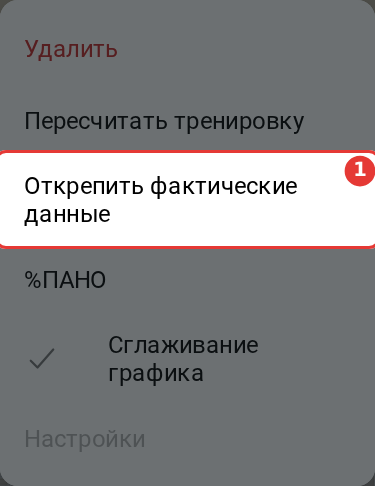
- Split activity into planned and completed. Open the activity, click the menu button in the top left corner of the activity window and choose “Split plan and actual data” (1). The app asks to confirm, and then two entries appear in the calendar: the planned one and the completed one. This item is available for activities whose actual data was uploaded from a watch or another service.
- Merge planned and completed activity. When the required planned and completed activities are standing separately, drag one onto the other with the mouse - in the calendar or in the dashboard. The app asks “Merge planned and completed activity?” - answer “Yes”.
Please note:
- only a plan and a fact can be merged: two completed or two planned activities cannot be merged;
- a completed activity cannot be moved to another day. If the plan is on another day, drag the plan onto the fact.
Calculated indicators
For each completed activity, lap, segment and part of the activity selected on the chart, Staminity calculates a set of indicators: distance, duration, cadence, elevation, grade, calories, intensity level, training load (TL), VAM, relative power, adjusted power and pace, variability index, decoupling. They are shown on the “Details” tab, and how each of them is calculated - see “Training indicators and load”.
Tools for analysis of a completed activity
Activity tabs
The activity tabs are the icons under its title:
- “Overview” - planned and actual values, the track map and the coach's task;
- “Segments” - only for a structured activity;
- “Details” - indicators and peaks; available for an activity with uploaded data;
- “Chat” - conversation with the coach;
- “Zones” - time in training zones.
On a wide screen there is a panel to the right of the tabs with the chart and the table of laps or segments. On a phone there is no such panel: the chart is shown on the “Details” tab and the laps - on a separate “Laps” tab.
Comparing planned and actual values - “Overview” tab
Total planned and actual values are compared on the “Overview” tab, and the percent of completion is shown in the activity header.
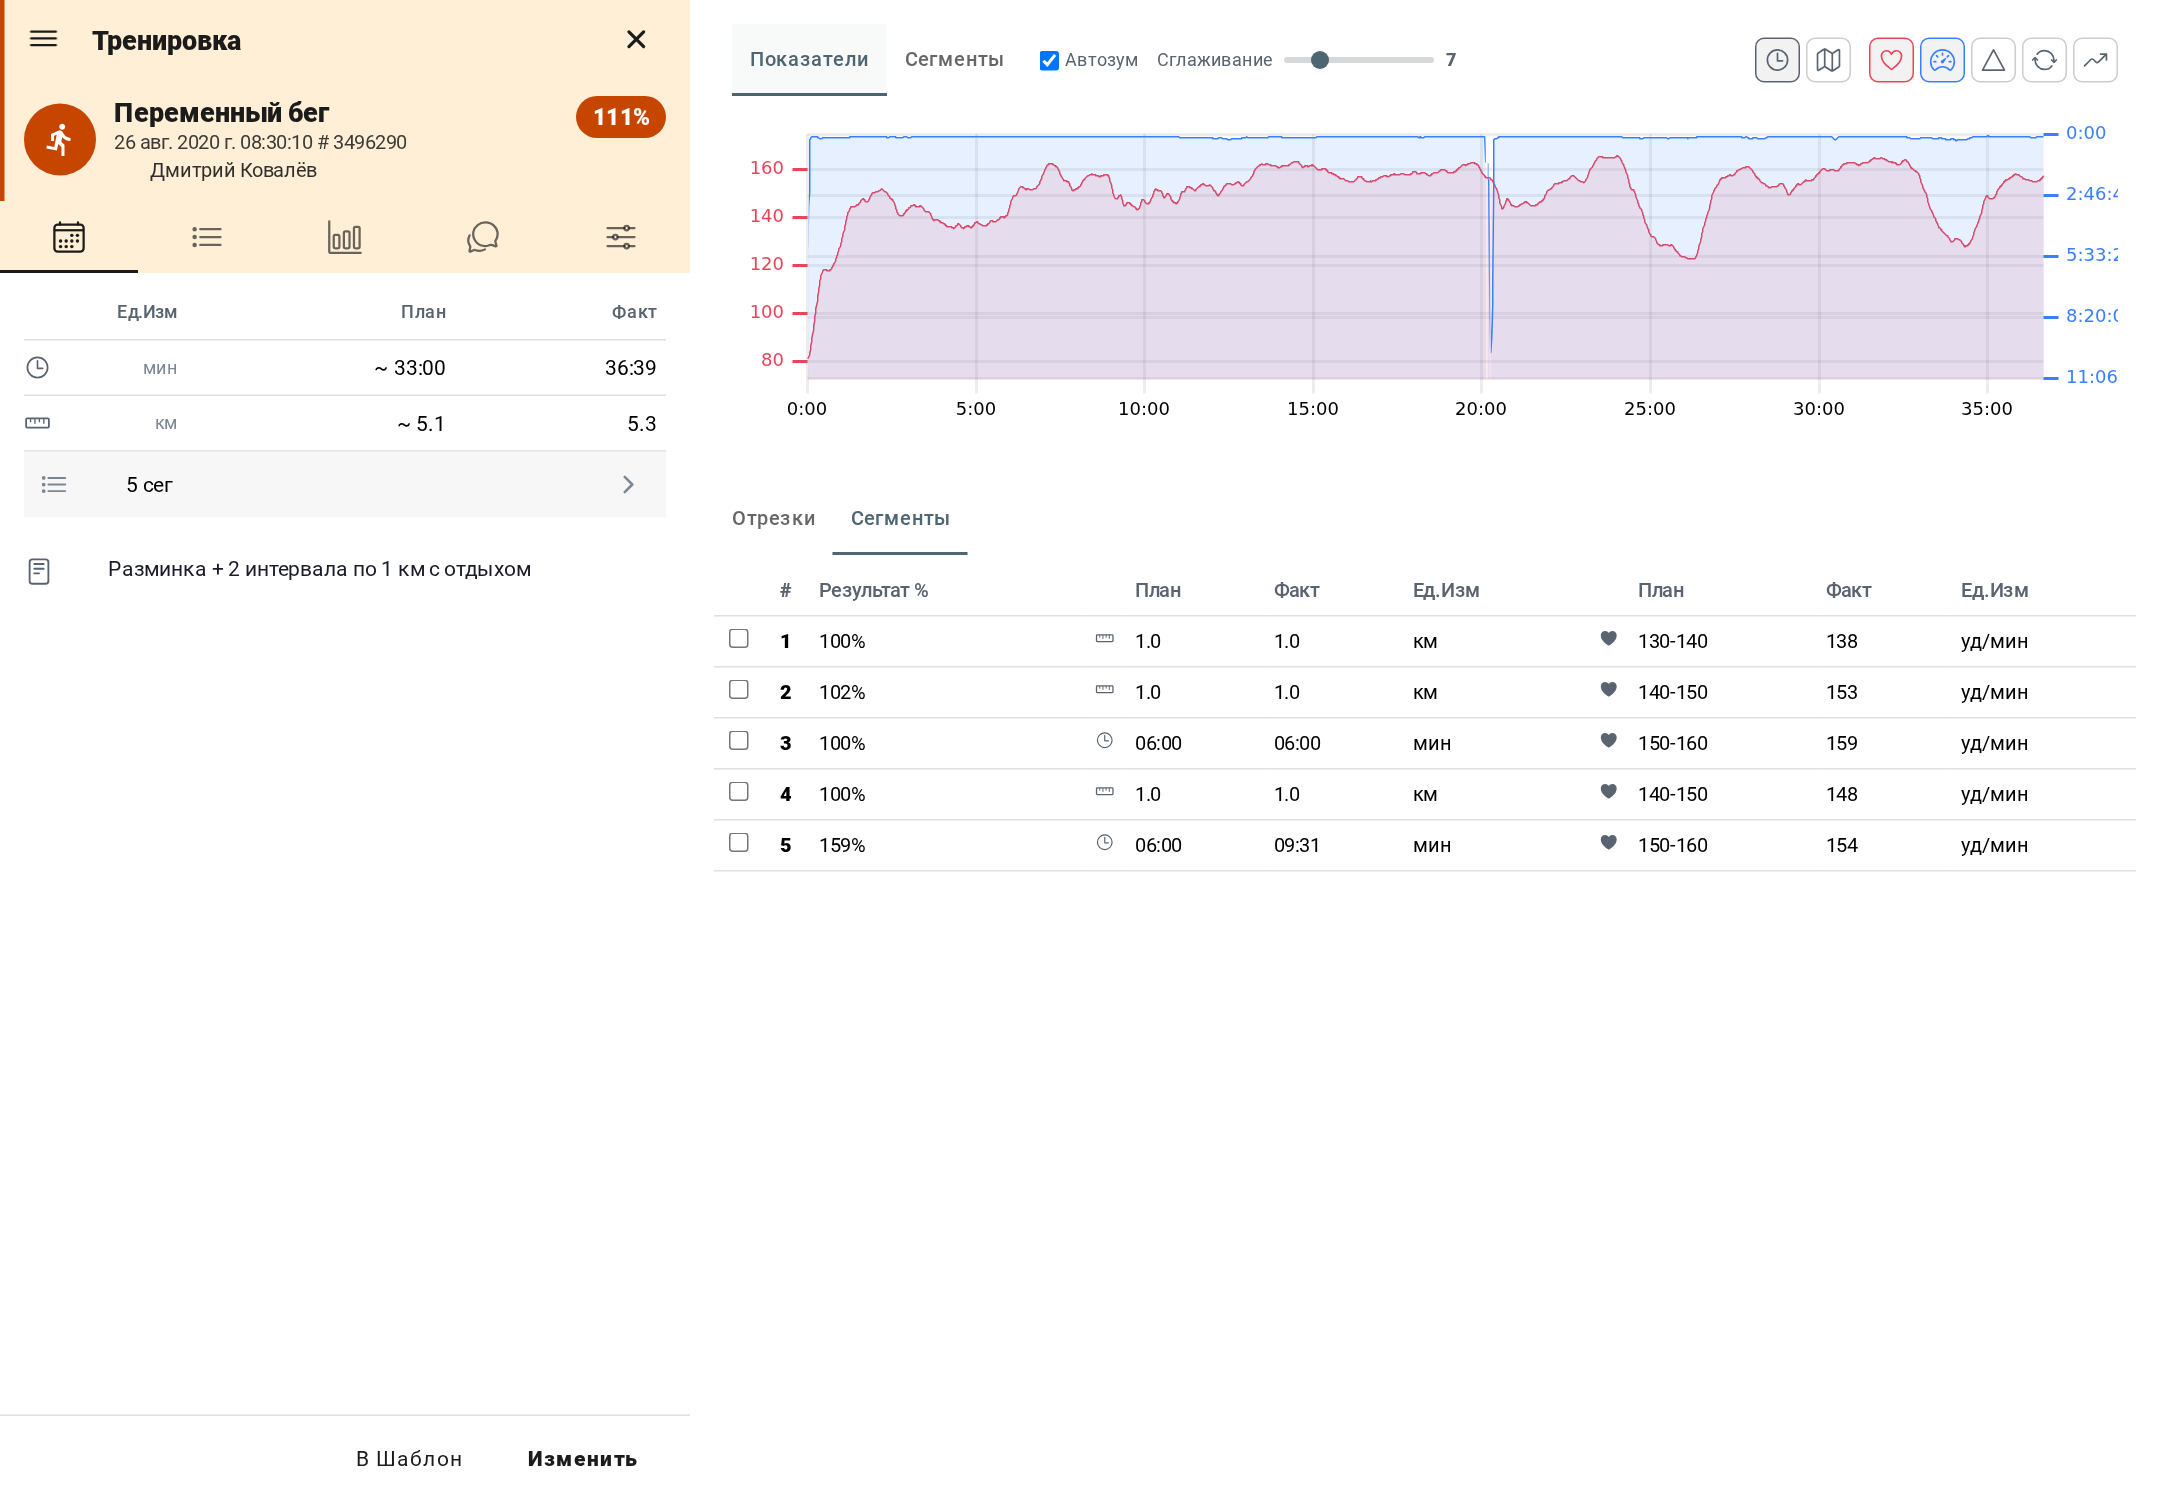
If duration/distance and intensity values are set in the planned activity, then the percent of completion is calculated according to the following formula:
% of completion = (% of completion by duration/distance) * (% of completion by intensity)
If only duration/distance is set in the planned activity, then only the actual duration/distance for the given indicator is taken into account when calculating % of completion.
Percent of completion for structured activities is calculated based on the percent of completion for each segment of the activity.
Indicators chart
There is an indicators chart in each completed activity with uploaded data.
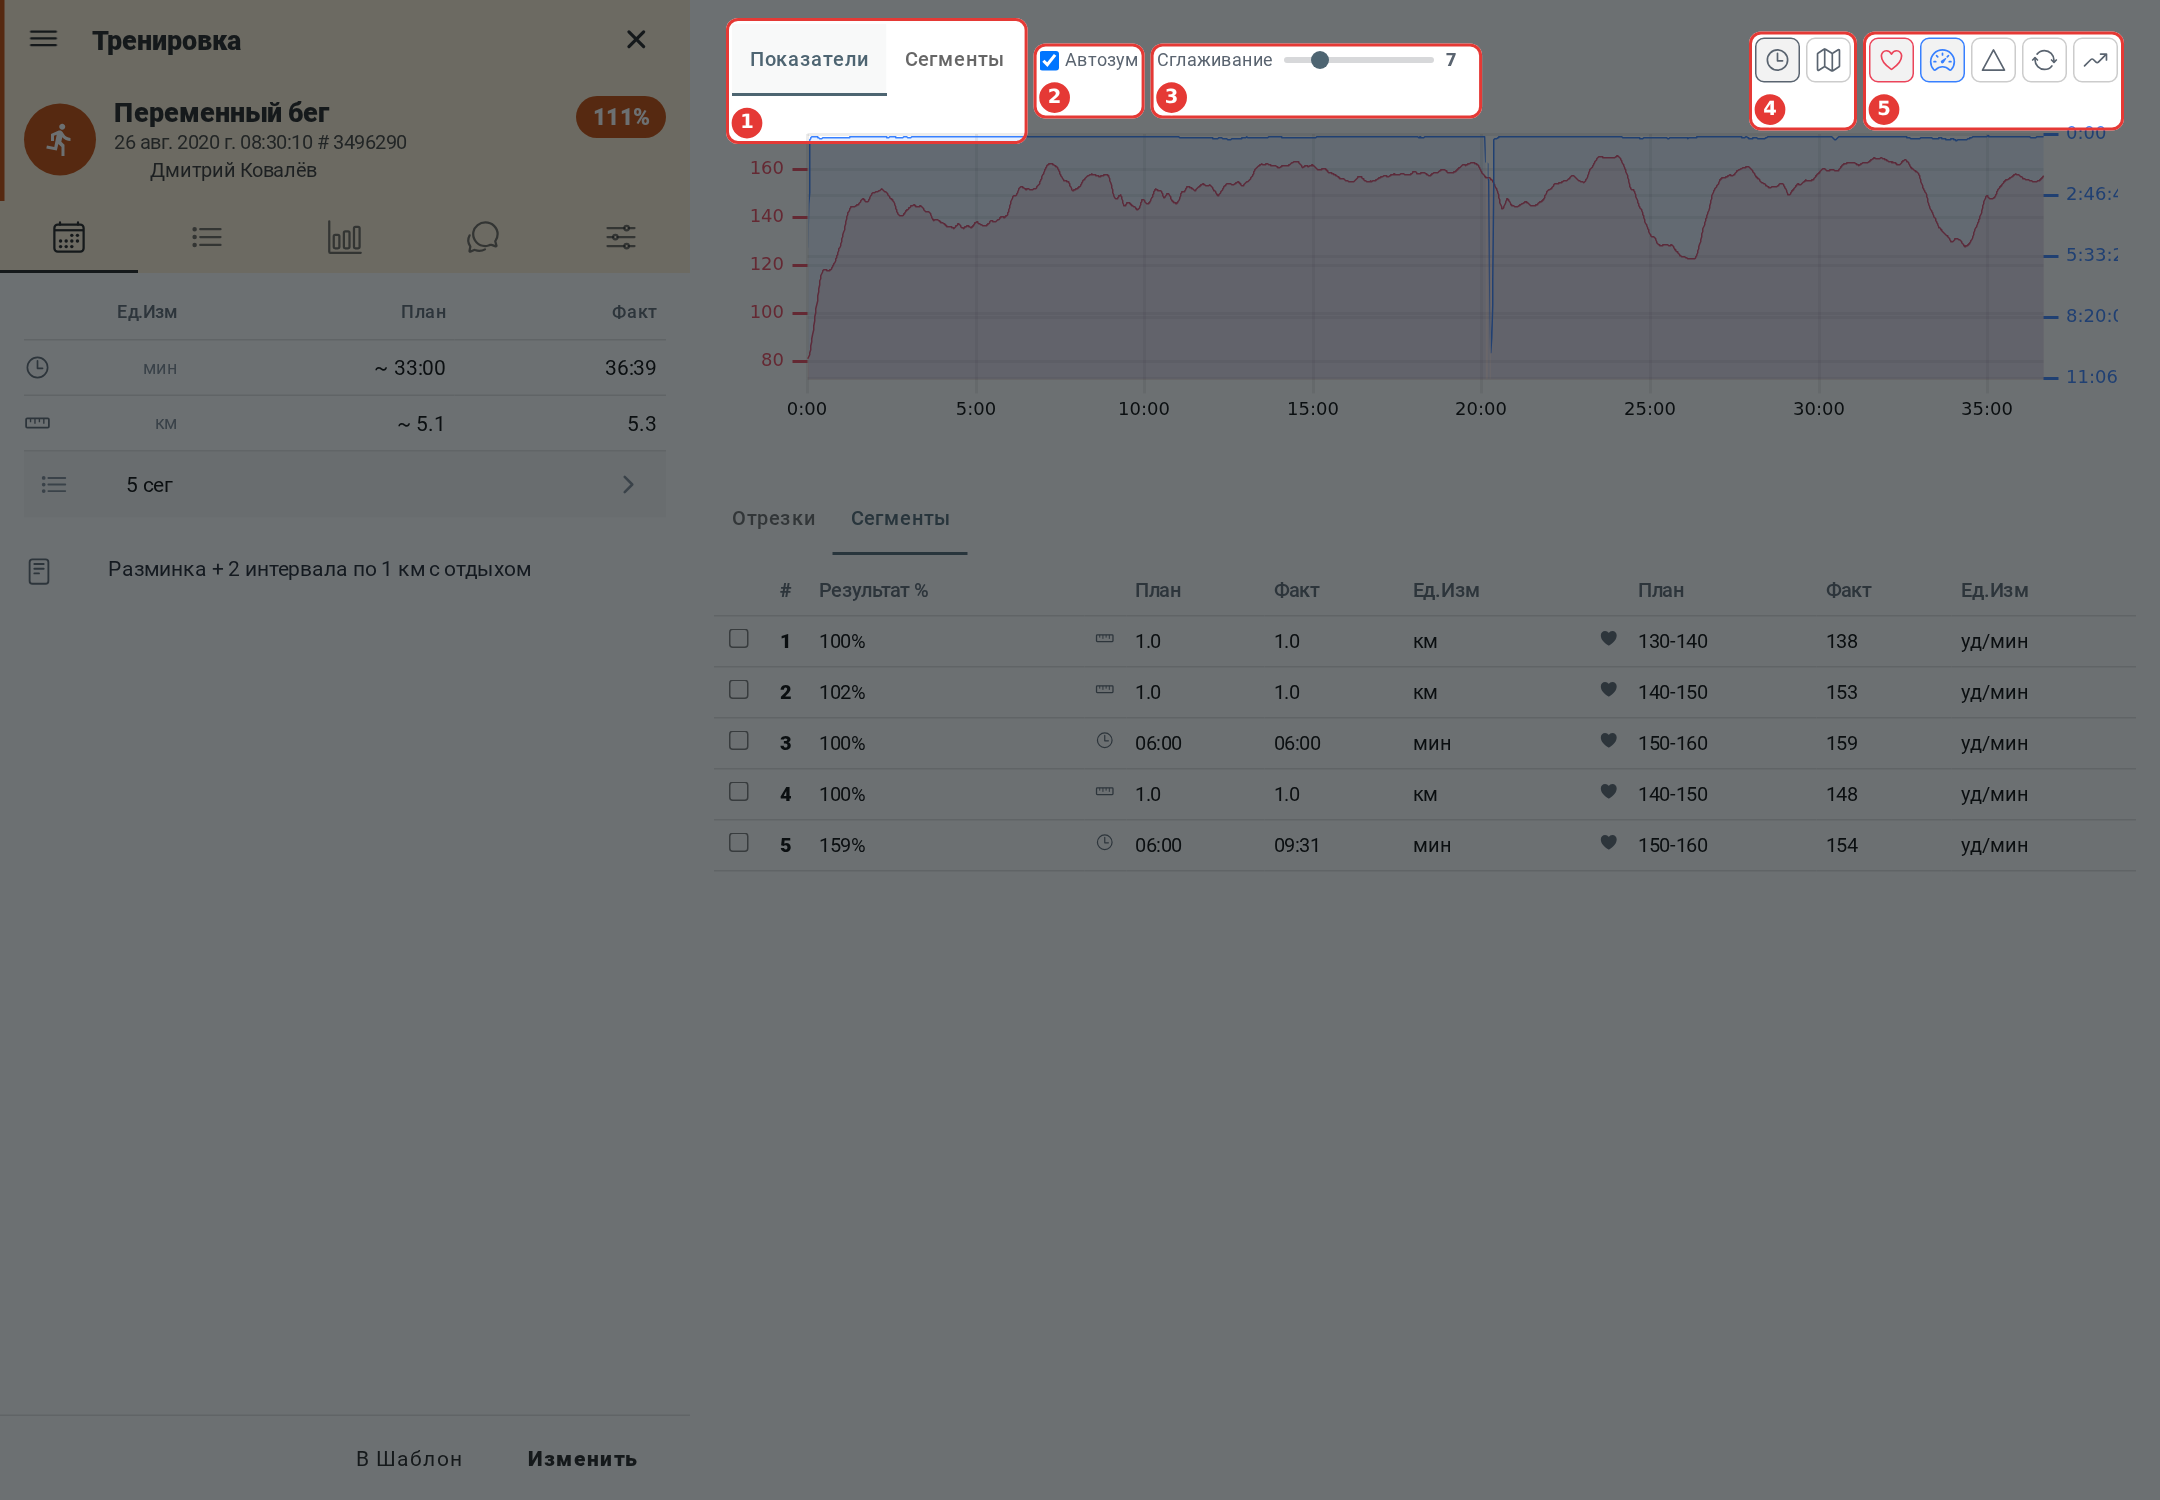
- 1 - Indicators / Segments: for a structured activity, switches between the indicators chart and the segments chart. For other activities the indicators chart is always shown.
- 2 - Auto zoom. If it is on, then when you select a part of the chart, the chart changes its scale and the selected part takes the whole width.
- 3 - Chart smoothing: the further right the slider, the stronger the smoothing. Smoothing can also be turned on and off in the activity menu - the “Chart smoothing” item.
- 4 - chart axis: by time or by distance.
- 5 - indicators on the chart: heart rate, pace or speed, altitude, cadence, grade. The set depends on what the device recorded.
To select a part of the activity, drag the mouse across the chart; a click on the chart removes the selection. The “Details” and “Zones” tabs are recalculated for the selected part.
Auto zoom and the smoothing slider are available on a wide screen. On a phone a part is selected with two fingers, and the chart scale does not change.
Calculated indicators - “Details” tab
Staminity calculates a set of indicators for the whole activity, as well as for any lap, segment and part of the activity selected on the chart.
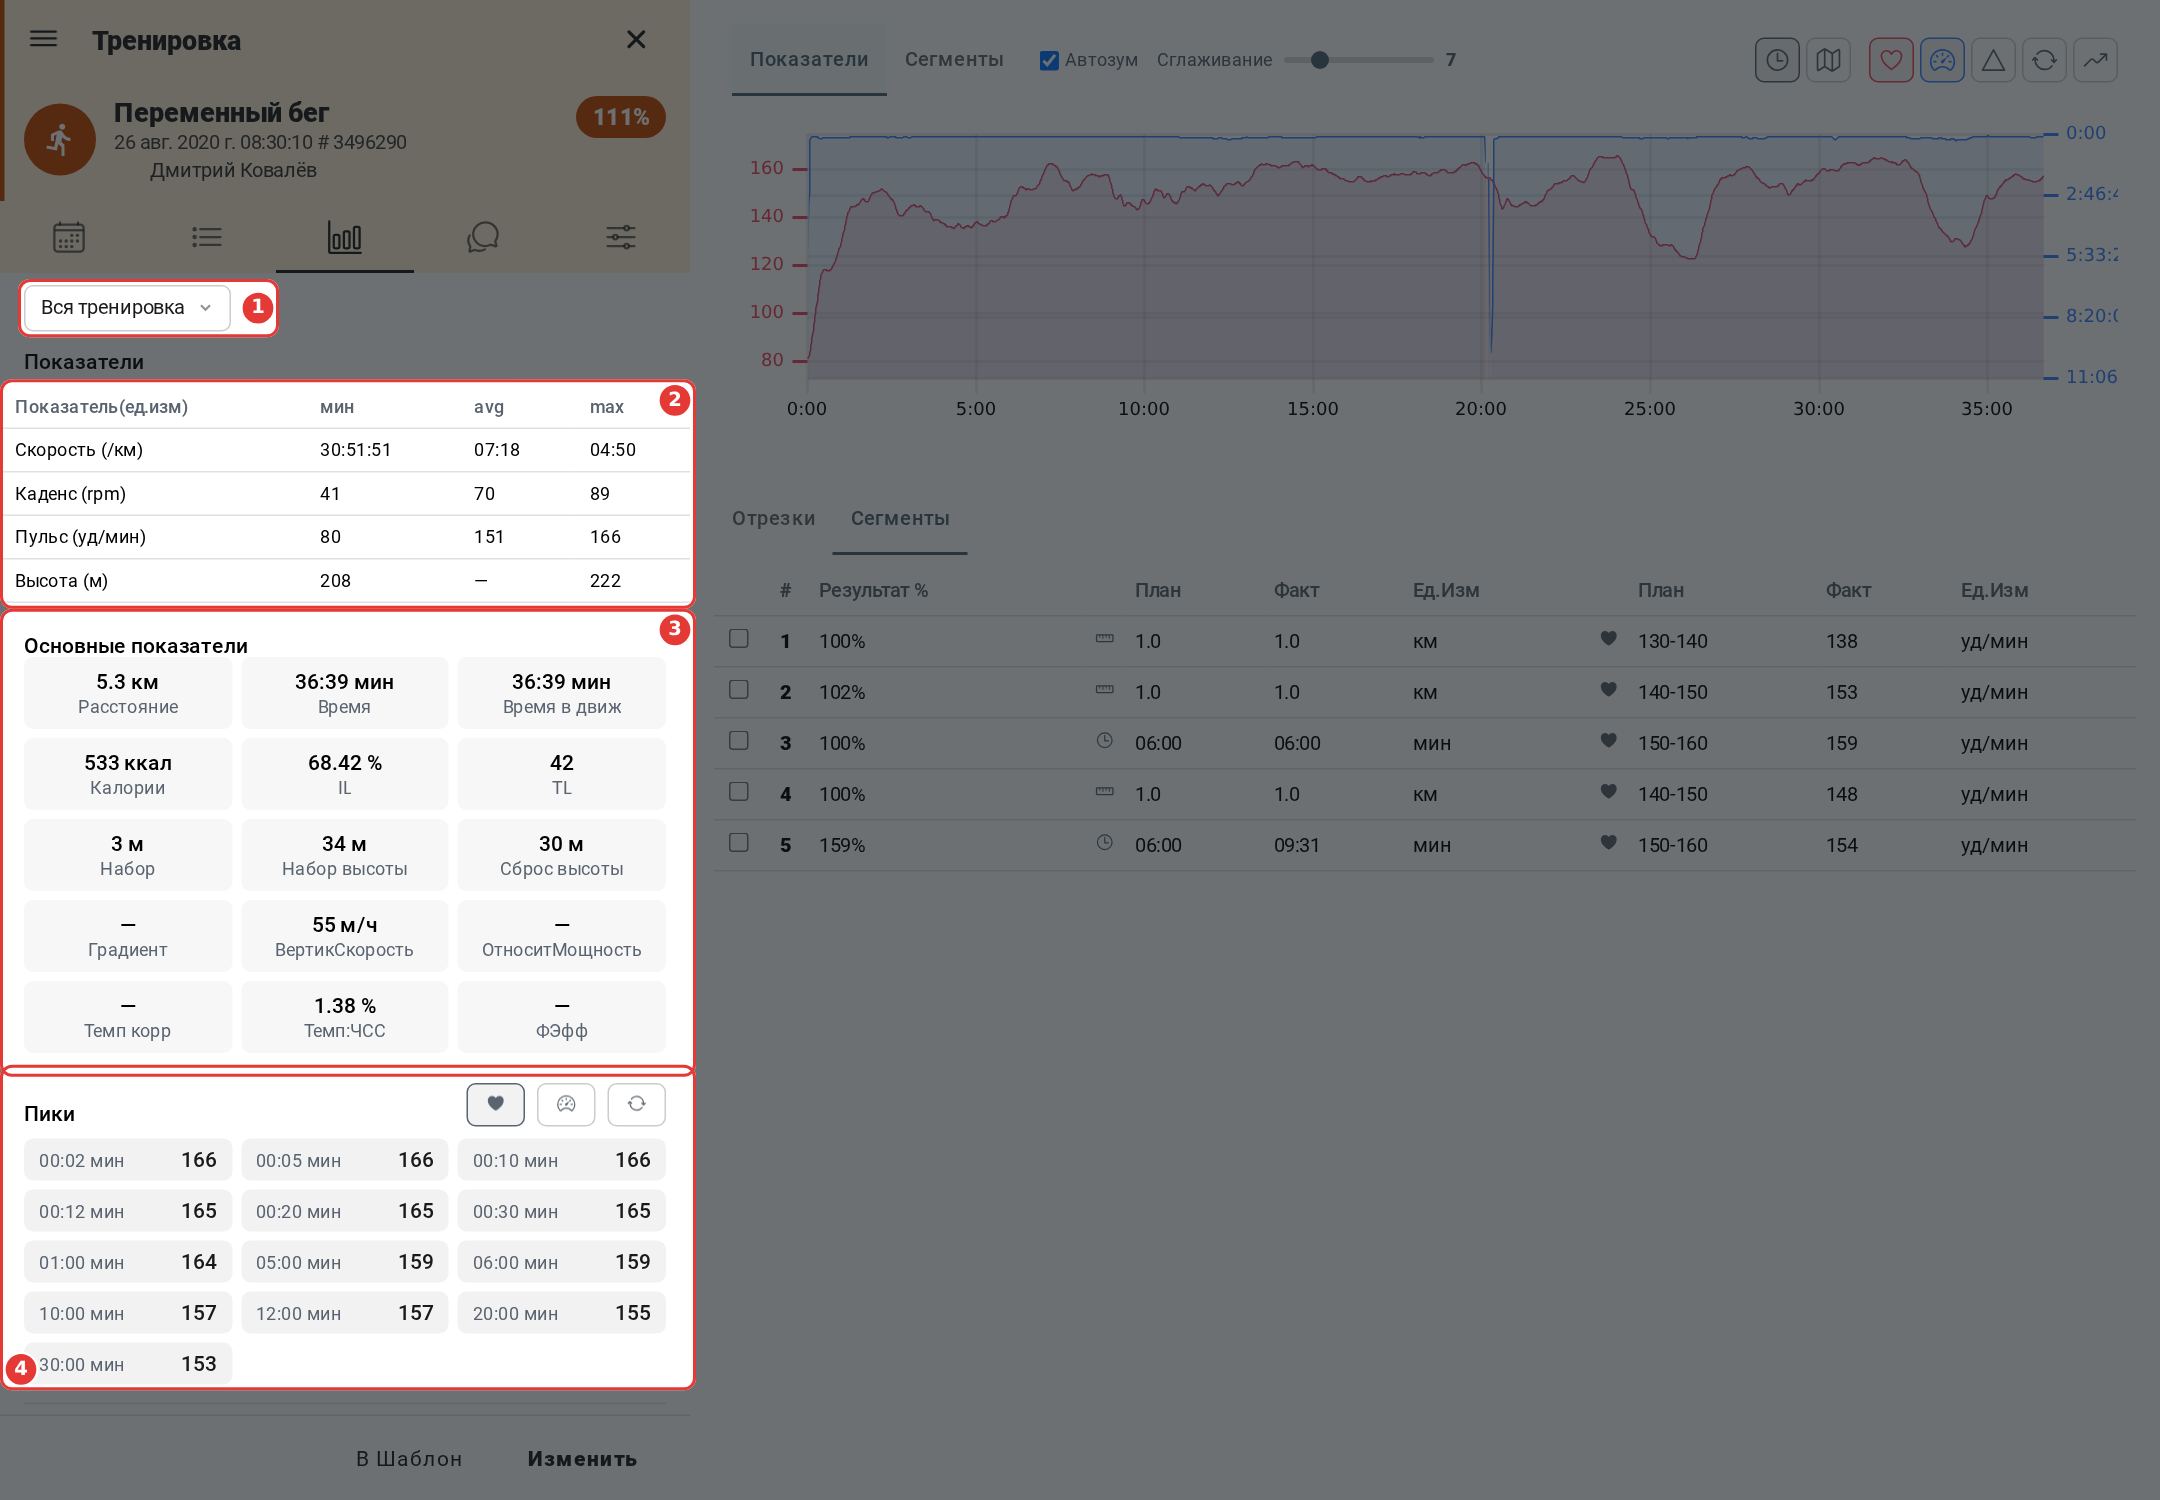
- 1 - what to calculate: “Whole activity”, a lap, a segment or a part selected on the chart. One lap or segment is selected at a time.
- 2 - indicators table: minimum, average and maximum values of speed or pace, cadence, heart rate, altitude.
- 3 - “Main indicators”: distance, time, moving time, calories, intensity level (IL), training load (TL), elevation gain and loss, grade, vertical speed, relative power. For activities with power - adjusted power, power:HR and variability index; for activities with pace and heart rate - adjusted pace, pace:HR and efficiency factor.
- 4 - “Peaks” - see below.
Underlined values were recorded by the device and were not recalculated.
How each indicator is calculated - see “Training indicators and load”.
The “Details” tab is available on the “Premium” tariff for your own activities and on the “Coach” tariff for your athletes' activities.
Peaks by time and by distance - “Details” tab
Peak - the maximum value of the moving average values for the selected interval by time or by distance.
For example, a 10-seconds heart rate peak of the activity is the maximum moving average value of heart rate among all 10-seconds parts of the activity.
Peaks are calculated by time and by distance, for heart rate, pace, power and cadence - the indicator is chosen with the buttons above the peaks.
As well as indicators, peaks are available for the whole activity, for a lap, for a segment and for a part selected on the chart.
Laps
The “Laps” table shows the main indicators for each lap: time, distance, heart rate and heart rate in % of LT, speed and speed in % of LT, elevation gain, cadence.
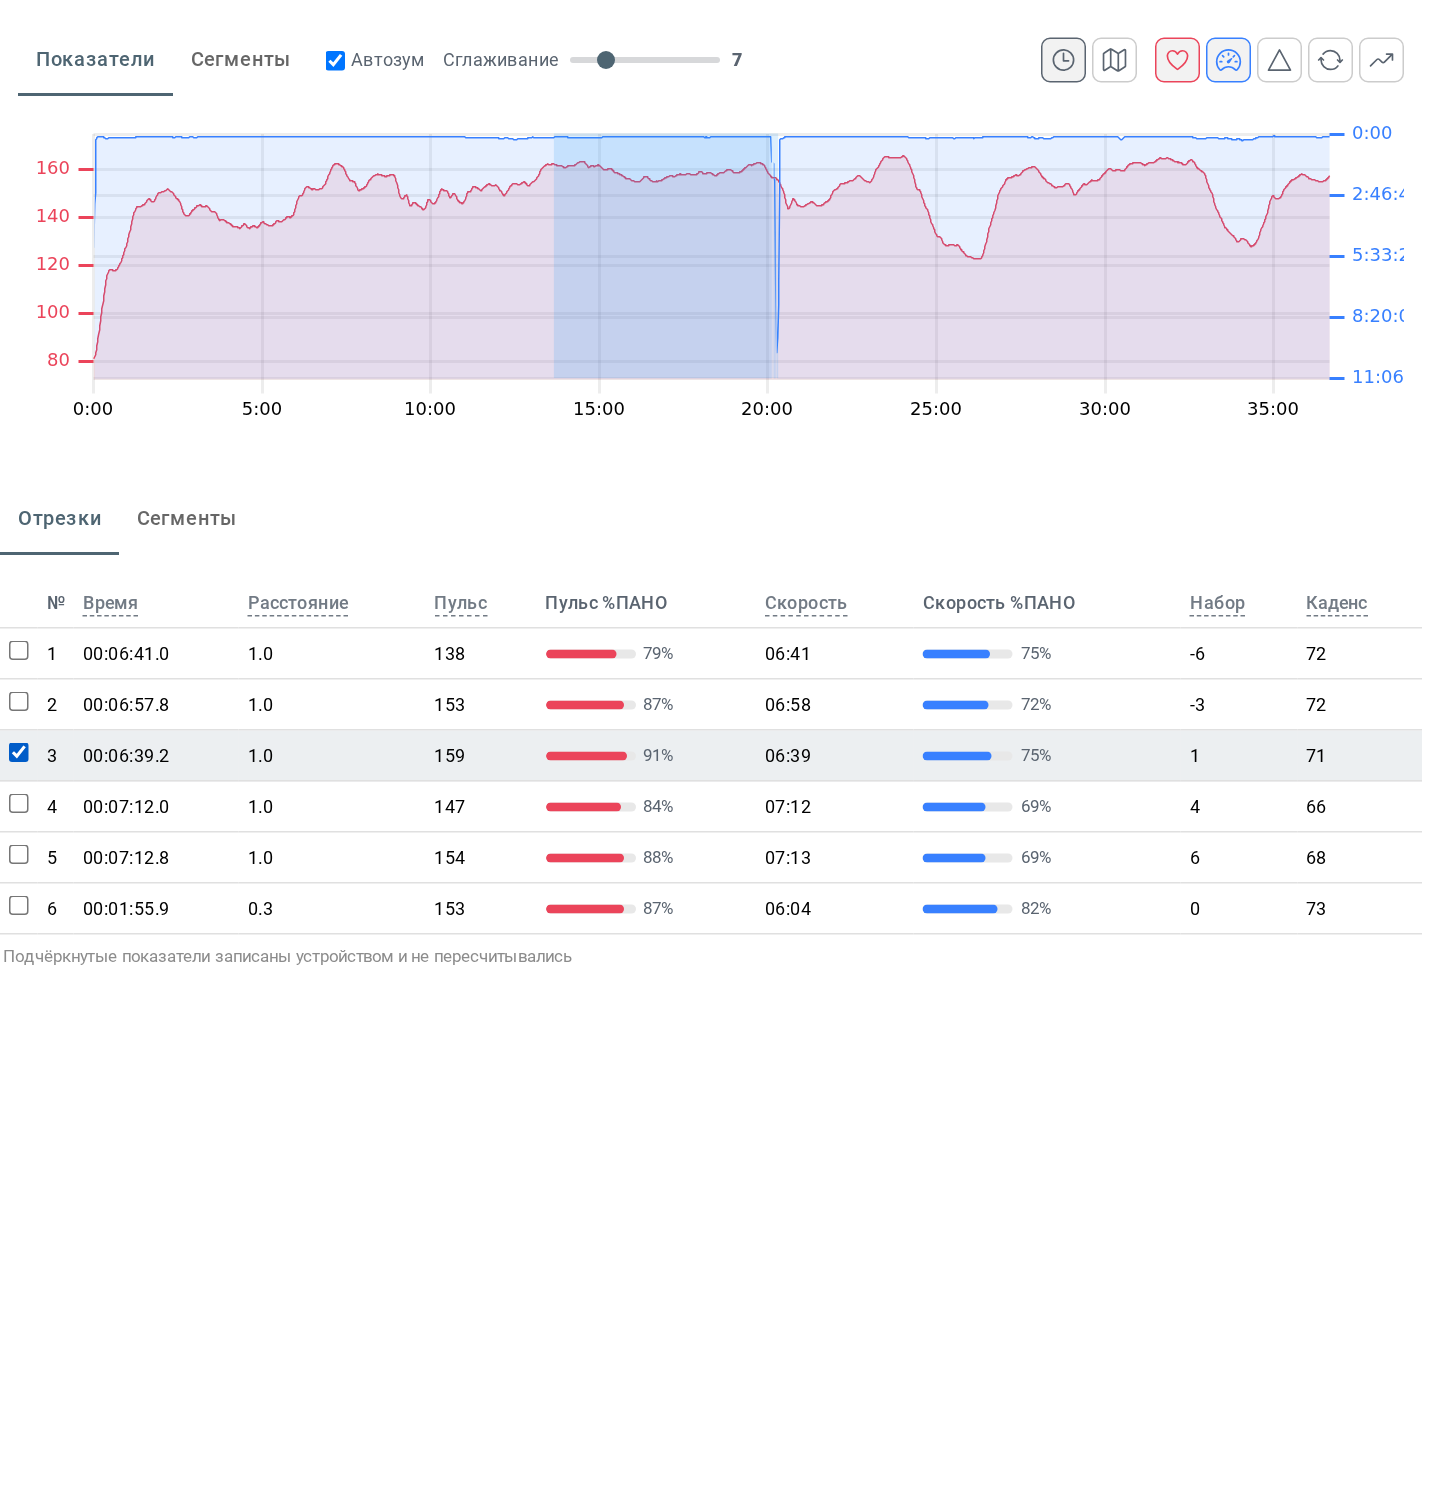
The lap checked in the table is highlighted on the chart and on the map, and the “Details” and “Zones” tabs are recalculated for it. One lap can be checked at a time.
On a phone the laps are on the “Laps” tab; a lap to calculate can be chosen in the list on the “Details” tab.
Time in zones
The “Zones” tab shows the activity time in each zone and its share, by heart rate, pace or speed, and power.
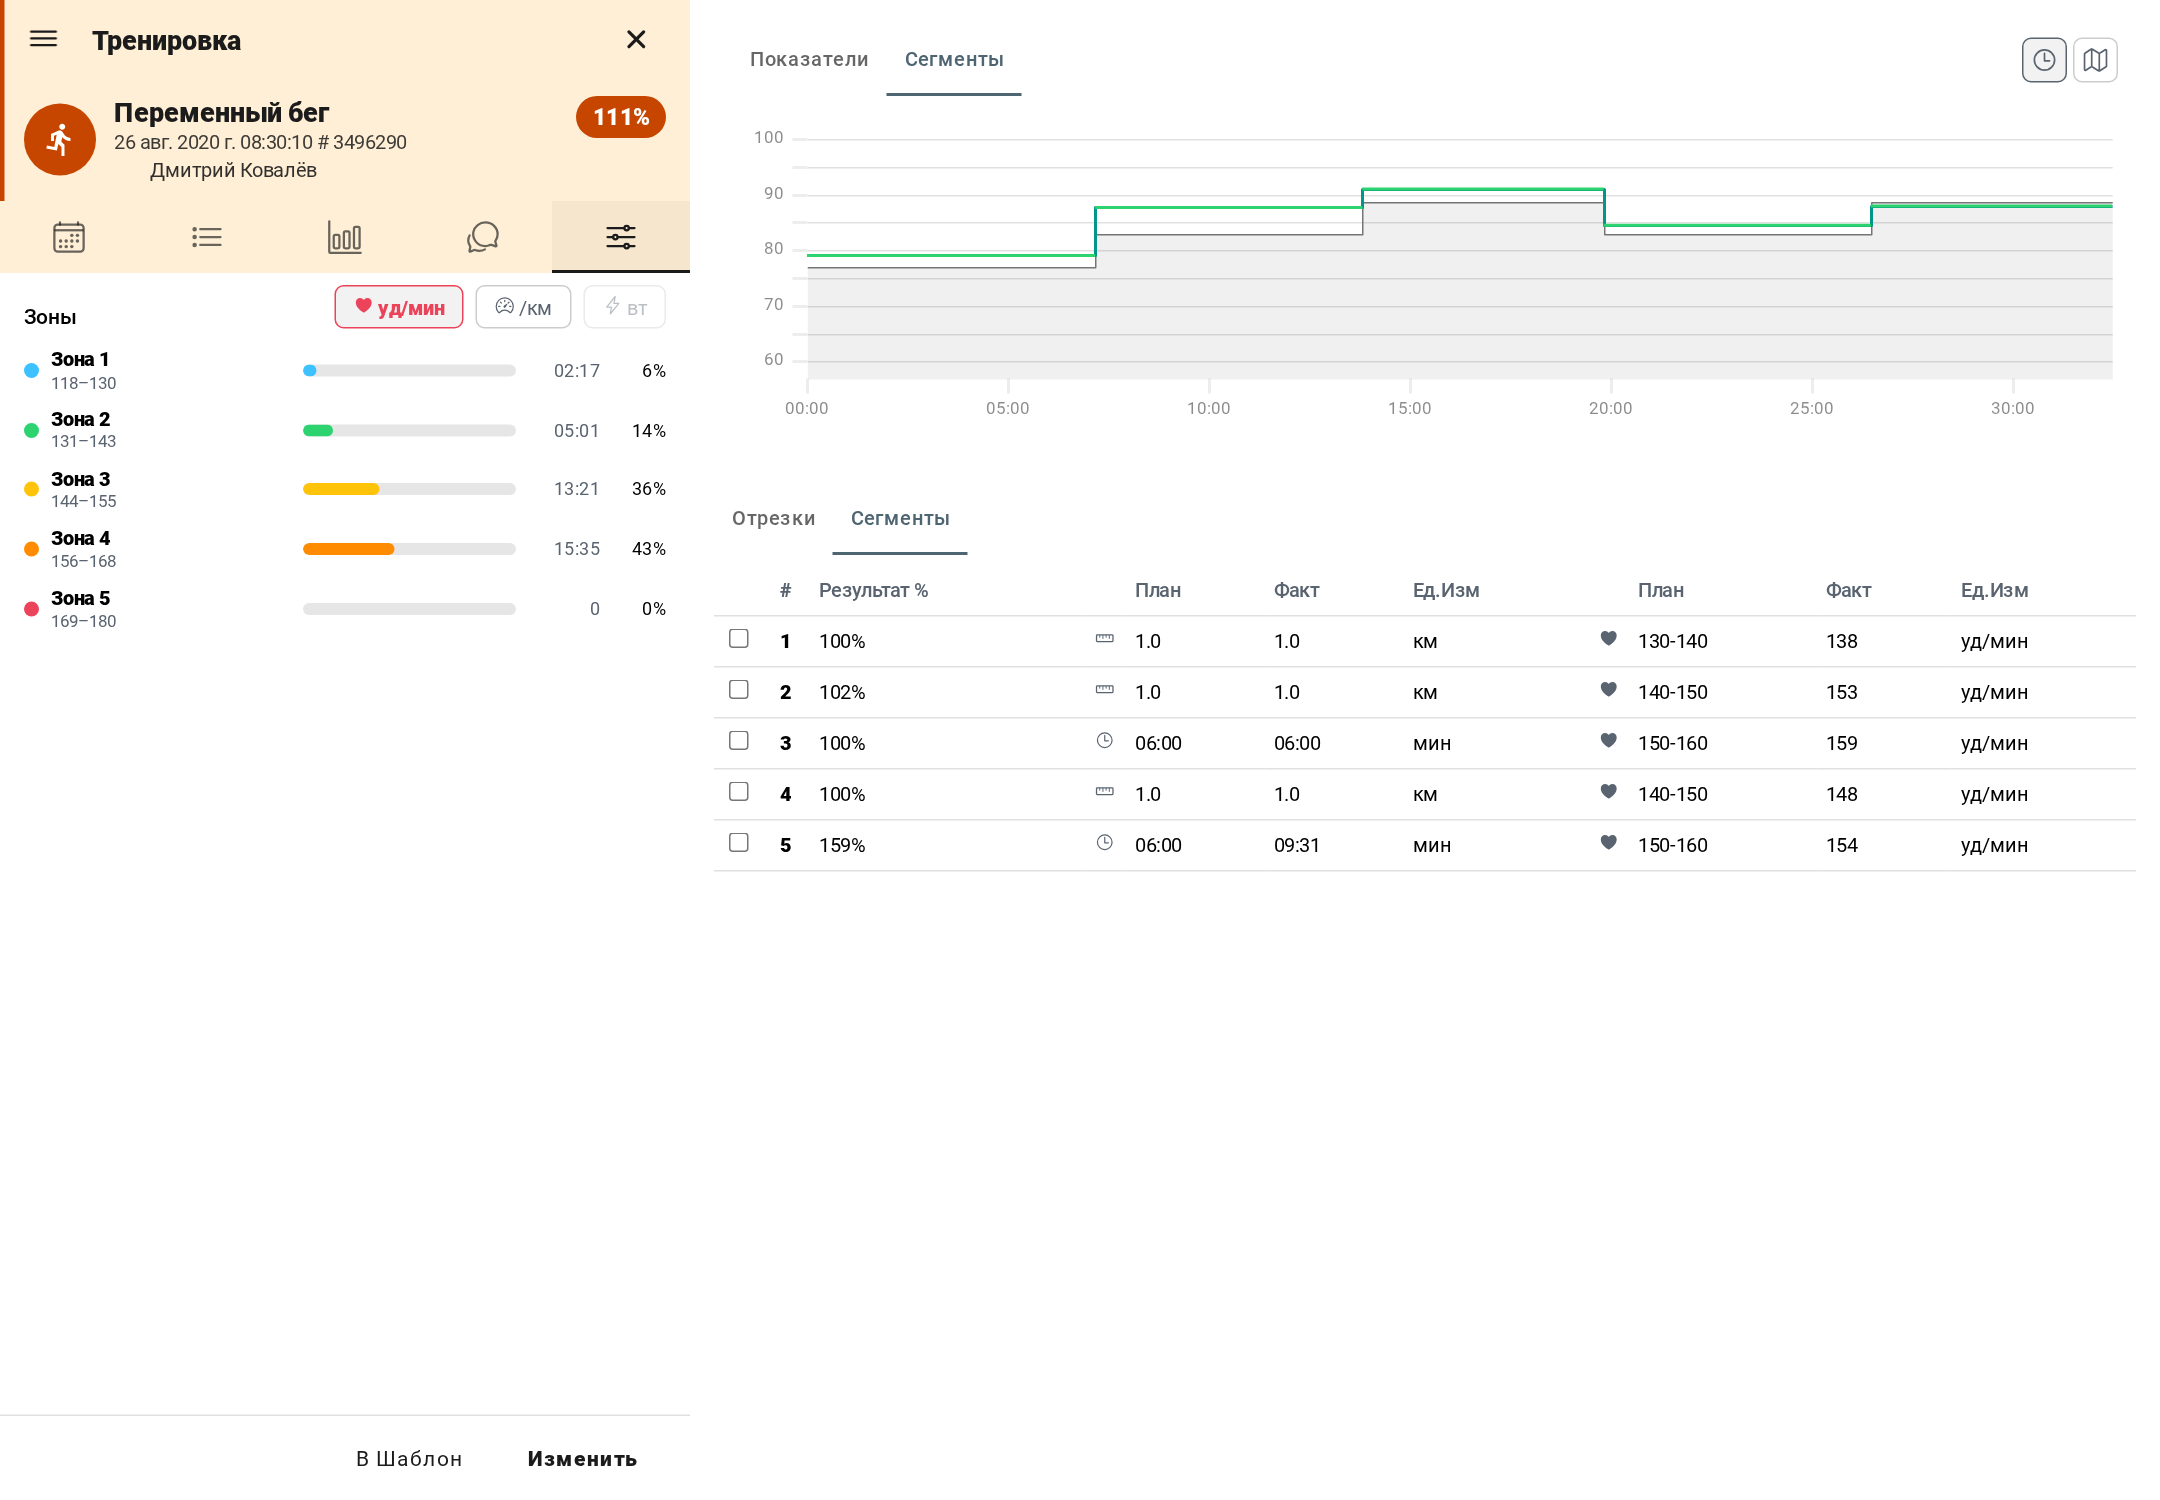
If a lap or a segment is checked, or a part of the chart is selected, the time in zones is calculated for it.
You can set up the training zones limits in the section "Settings” - “Zones”
Analysis of a structured activity by segments
A structured activity, planned by segments, has the “Segments” tab:
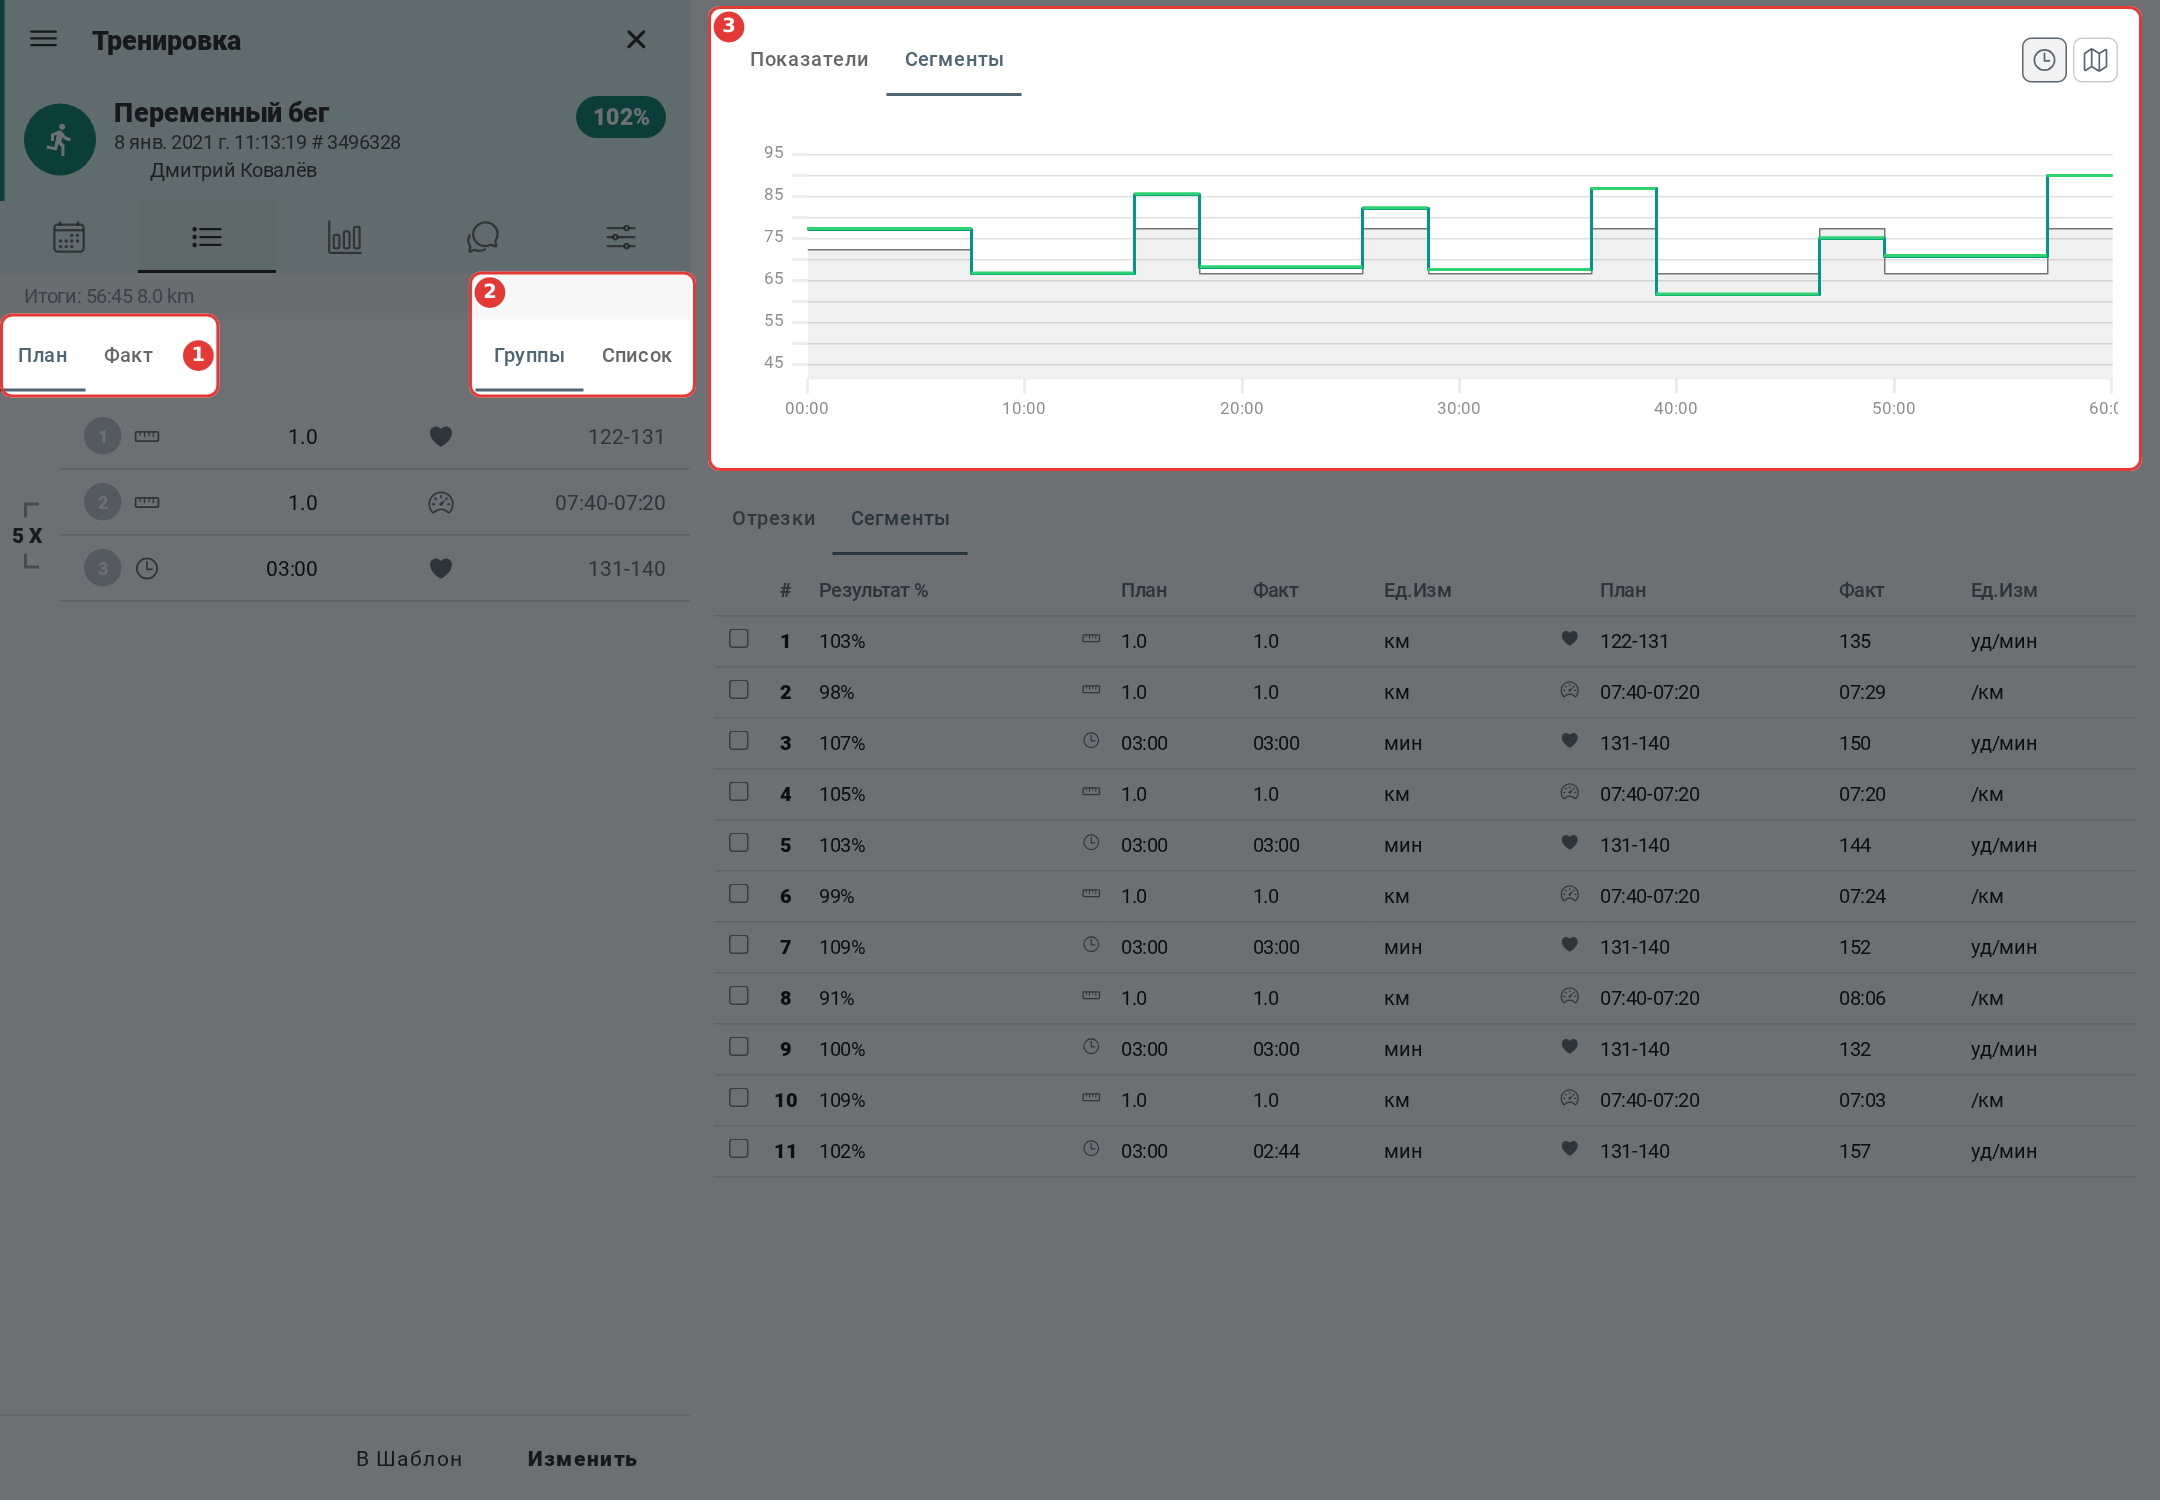
- 1 - “Plan / Fact”: planned or actual values by segments.
- 2 - “Groups / List”: segments by groups of repeats or as a list, each one separately.
- 3 - segments chart. The x-axis is the time or distance of the activity, the y-axis - % of LT for the intensity indicator set in the plan (heart rate, speed or pace, power). The plan is shown in grey, the fact - with a colored line. The color shows the segment's completion: green - 90% of the plan and more, orange - from 80 to 90%, red - less than 80%.
Under the chart there is the “Segments” table: percent of completion, planned and actual duration and intensity for each segment. When you check a segment in the table, the “Details” and “Zones” tabs are recalculated for it.