How to analyze a completed activity
Analysis tools
The following information is available in a completed activity, uploaded from sports watch or from smartphone:
- Comparing planned and actual values - “Overview” tab";
- Indicators chart;
- Calculated indicators - “Details” tab;
- Peaks by distance and by time - “Details” tab;
- Laps panel;
- Time in zones;
- Planned and completed values by segments, segments chart, segments panel - for structured activities.
Calculated indicators
Staminity calculates a set of indicators for each completed activity, each lap, segment or part of activity randomly selected on a chart. The calculations are made based on the data recorded by sports watch or by an application on the smartphone.
The information is displayed on the “Details” tab in activity which is available for users with “Premium” and “Coach” tariffs enabled.
It includes the following indicators:
- Distance
- Duration
- Cadence
- Elevation gain and loss
- Grade
- Average HR
- Calories
- Intensity level
- Training load
- VAM
- Relative power
- Average power and adjusted power
- Average pace and adjusted pace
- Variability index
- Decoupling and efficiency factor
Tools for analysis of completed activity
The following information is available in a completed activity, uploaded from sports watch or from smartphone.
Comparing planned and actual values - “Overview” tab
Total planned and actual values are compared on the “Overview” tab.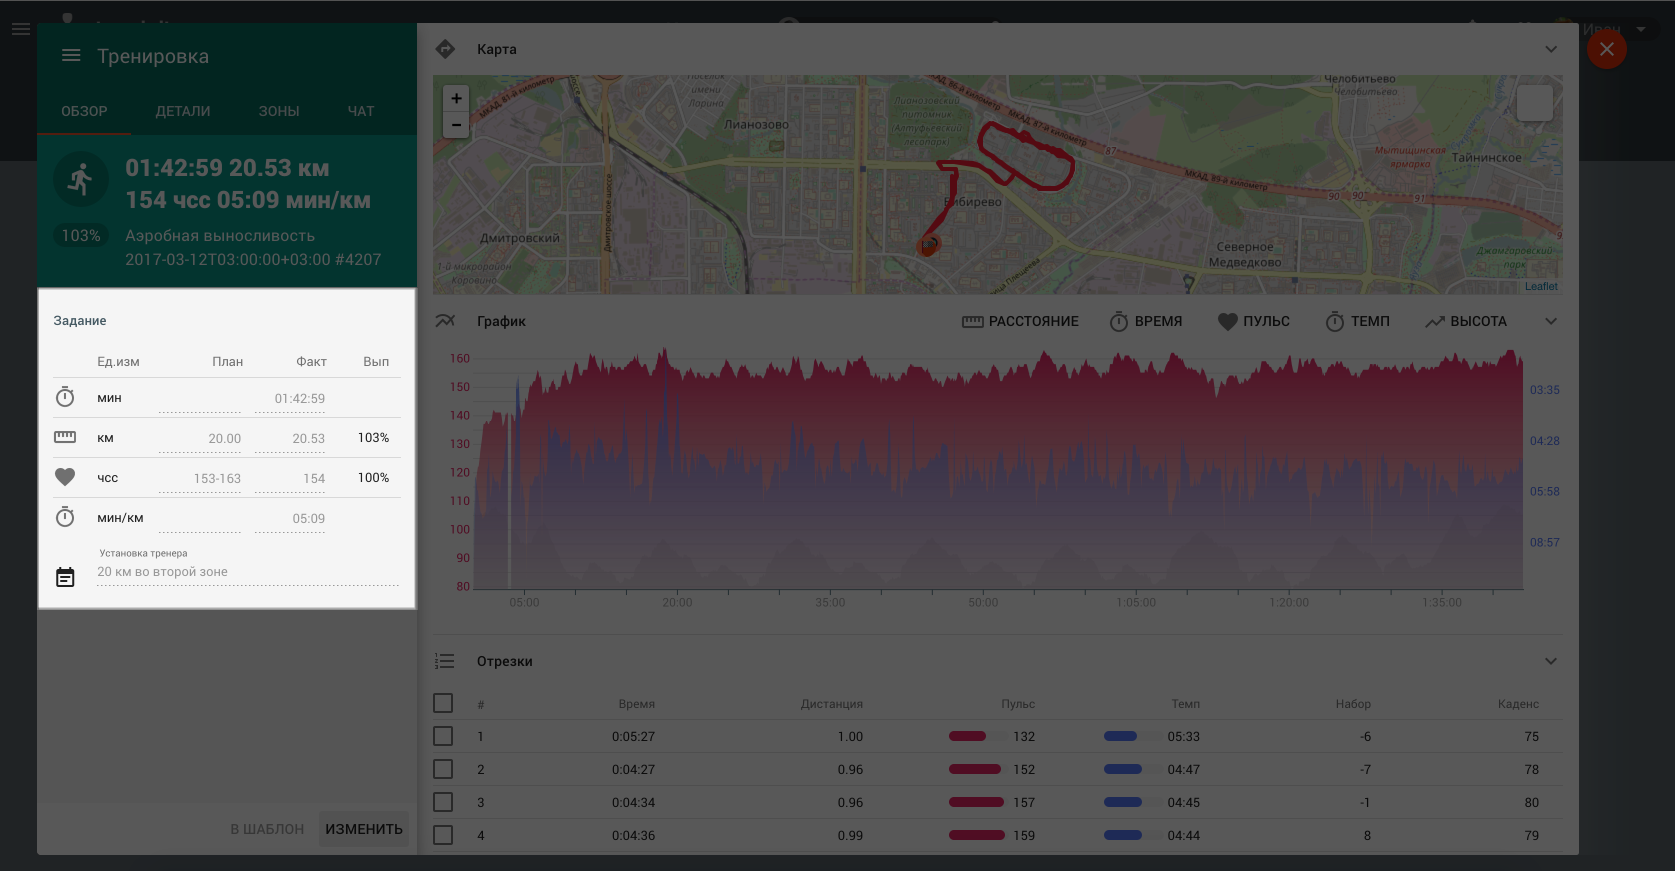
Percent of the planned activities’ completion is calculated based on the results of the planned and actual values of duration/distance and intensity indicators comparison.
If duration/distance and intensity values are set in the planned activity, then calculation is performed according to the following formula:
% of completion = (% of completion by duration/distance) * (% of completion by intensity)
If only duration/distance is set in the planned activity, then only the actual duration/distance for the given indicator is taken into account when calculating % of completion.
Percent of completion for structured activities is calculated based on the percent of completion for each segment of the activity.
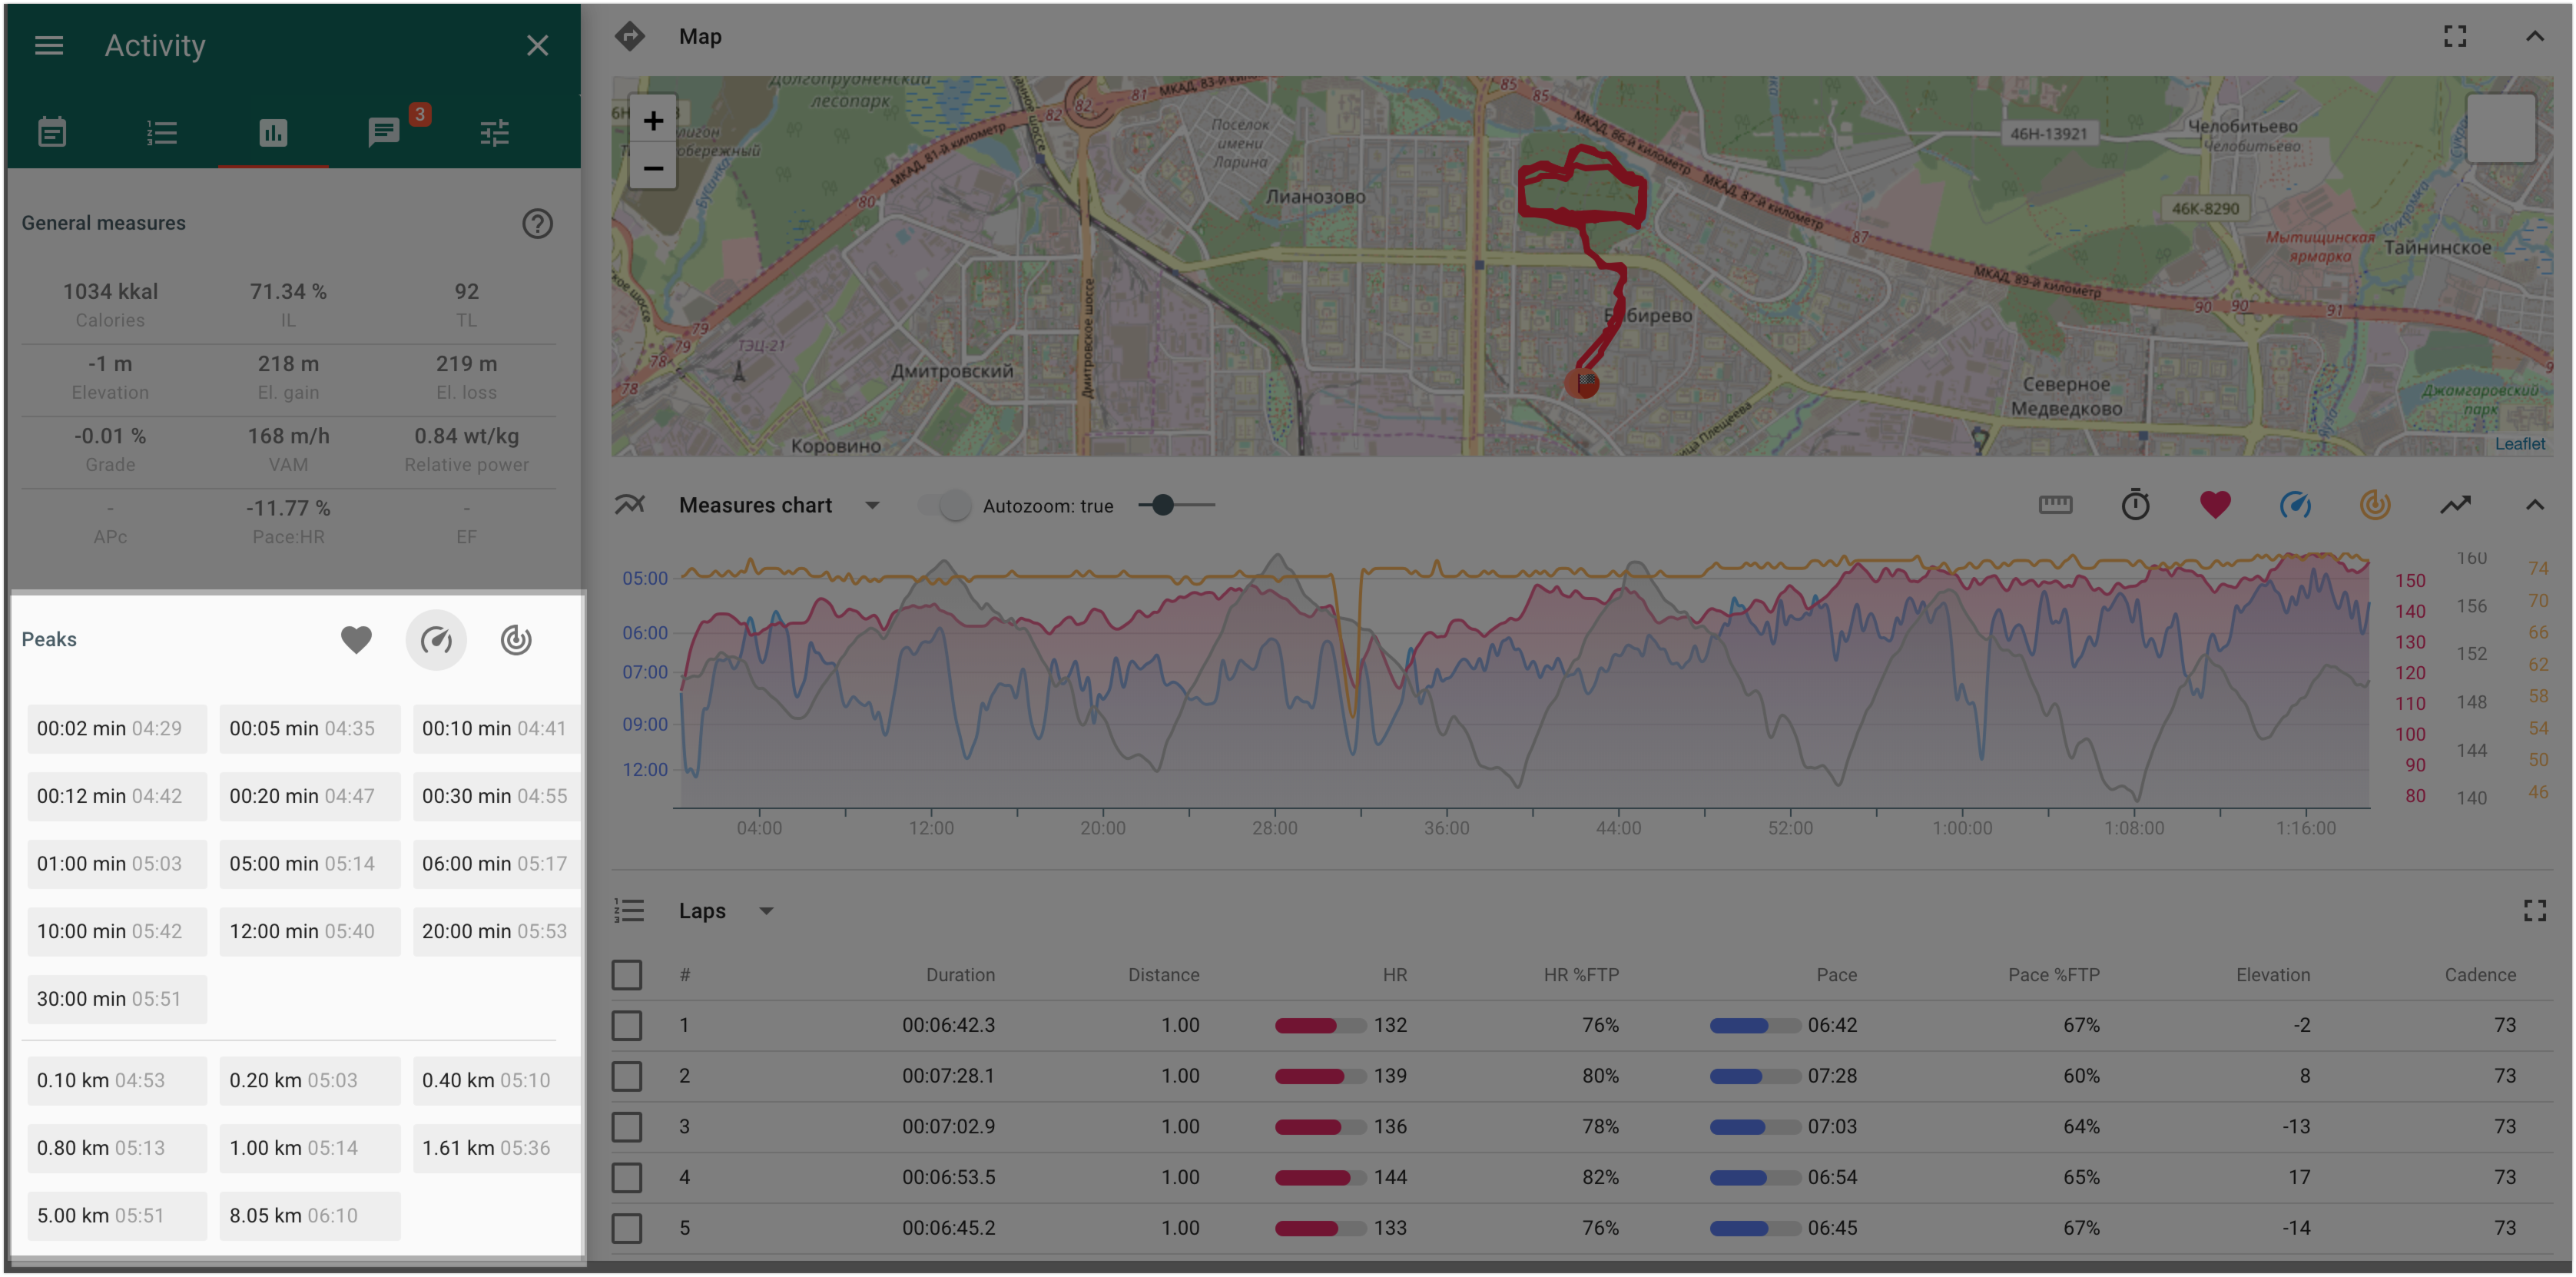
Indicators chart
There is an indicators chart for each completed activity.
The chart is composed by time or by distance and displays the following indicators (the set depends on the list of indicators recorded by the device):
- heart rate;
- power;
- pace/speed;
- altitude;
- cadence.
Elements of the chart management: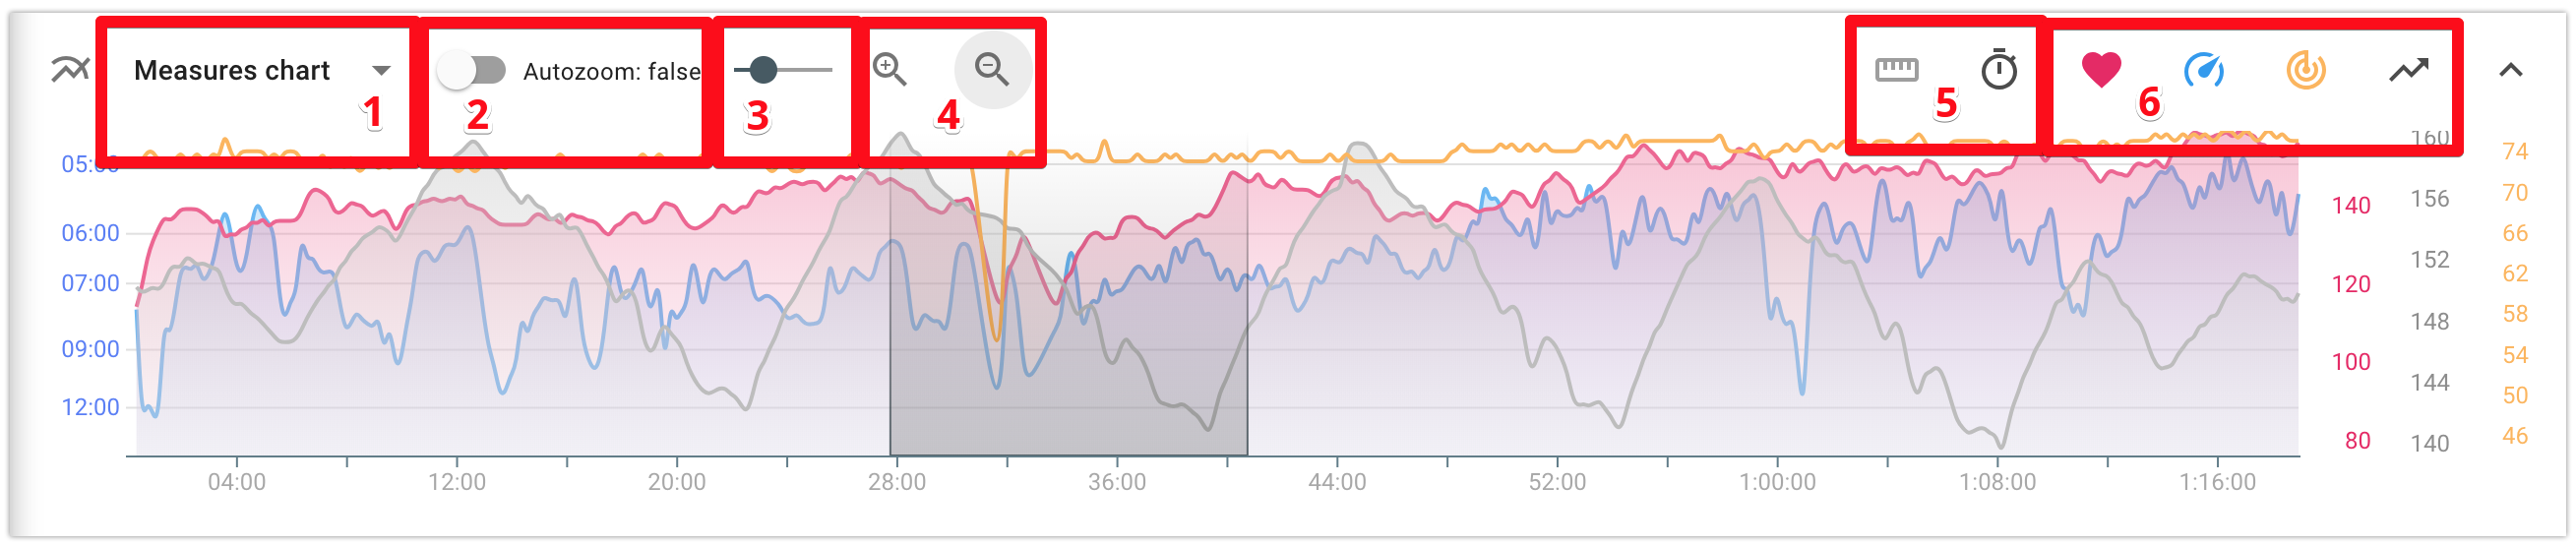
- 1 - Сhart selector: indicators chart/segments chart. It is available only for structured activities and allow to switch between indicators chart and segments chart.
- 2 - Turn on/turn off the auto zoom attribute. If the auto zoom is turned on, then when you select a part of the chart, it changes its scale and the selected part is displayed at full width of the screen.
- 3 - Set up chart smoothing. By changing the position of the cursor you can set the degree of the indicators’ smoothing on the chart.
- 4 - "Zoom in" and "Zoom out" buttons allowing to manage the zoom level of the chart. They appear if the auto zoom is turned off (2)
- 5 - Choose layout of the chart: by duration or by distance;
- 6 - Manage set of indicators to be displayed;
Calculated indicators - “Details” tab
Staminity calculates a set of indicators as for a whole activity, as for a lap, segment or any part of the activity.
The calculated indicators are described below in the section "Calculated indicators"
The indicators are located on the “Details” tab which is available for users with “Premium” and “Coach” tariffs enabled.
There are indicators available:
- for a whole activity;
- for a selected lap or several laps from the list of laps;
- for a selected segment or several segments from the list of segments;
- for any part of the activity, selected on the chart.
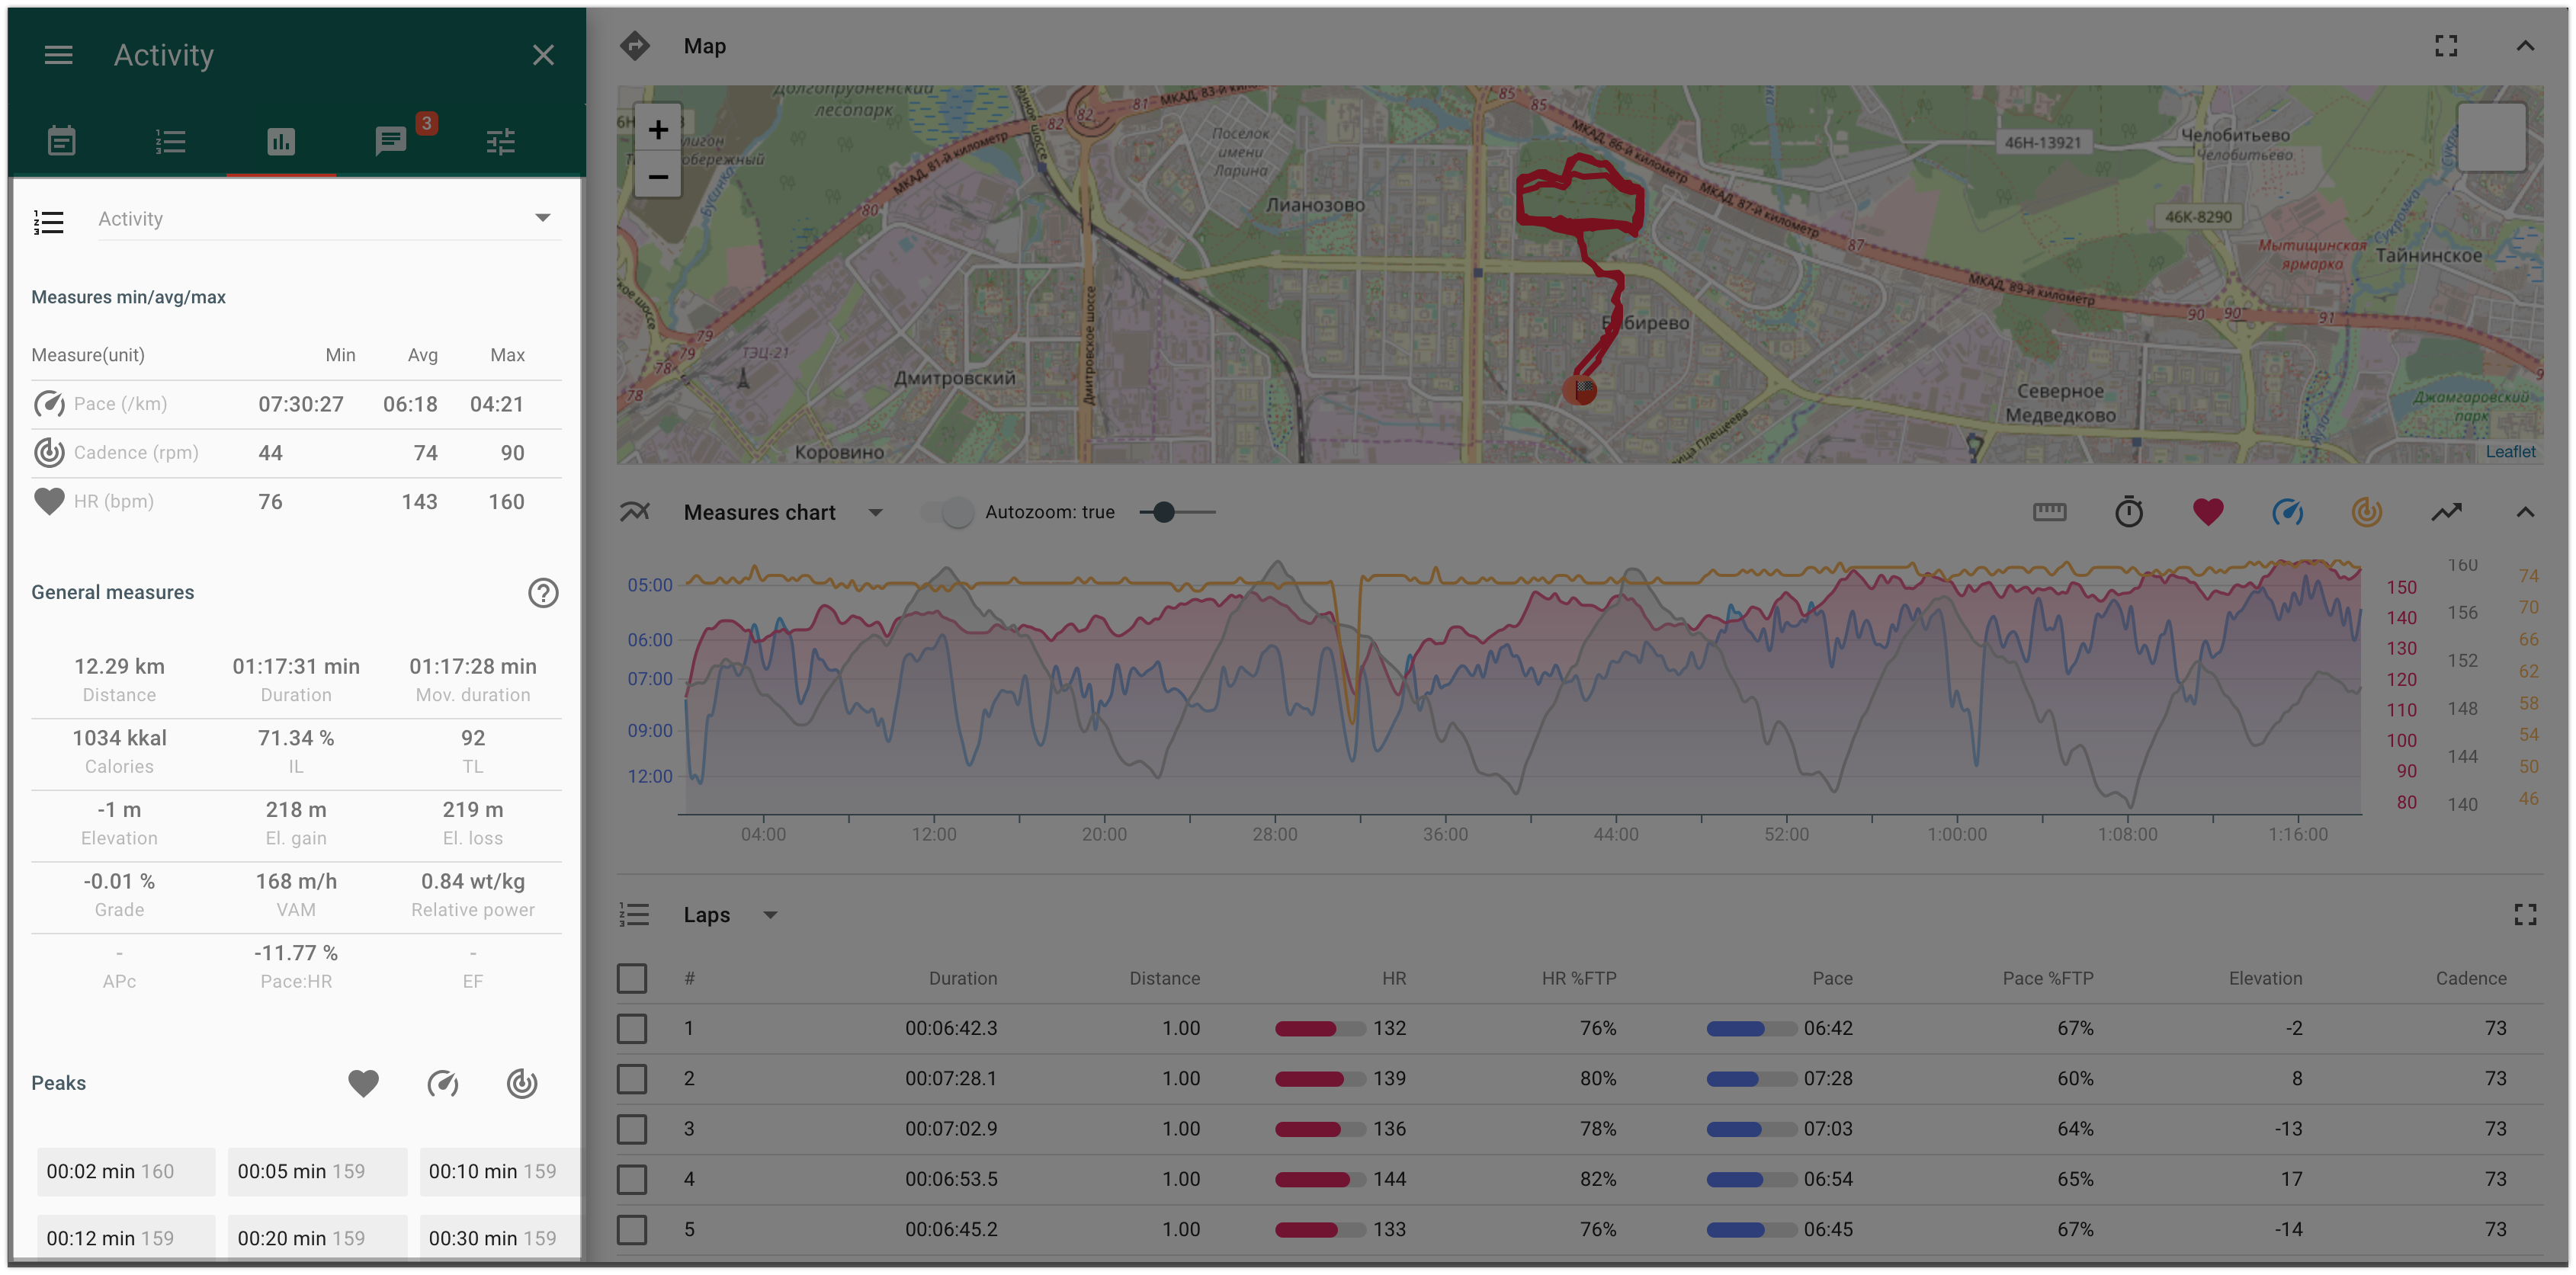
Peaks by distance and by time - “Details” tab
Peak - the maximum value of the moving average values for the selected interval by time or by distance.
For example, a 10-seconds heart rate peak of the activity is the maximum moving average value of heart rate among all 10-seconds parts of the activity.
Peaks are calculated by time and by distance for the following indicators:
- heart rate
- pace
- power
As well as indicators, there are peaks available:
- for a whole activity;
- for a selected lap or several laps from the list of laps;
- for a selected segment or several segments from the list of segments;
- for any part of the activity, selected on the chart.
Laps panel
In the laps table, you will find information about the main duration/distance and intensity indicators for each lap.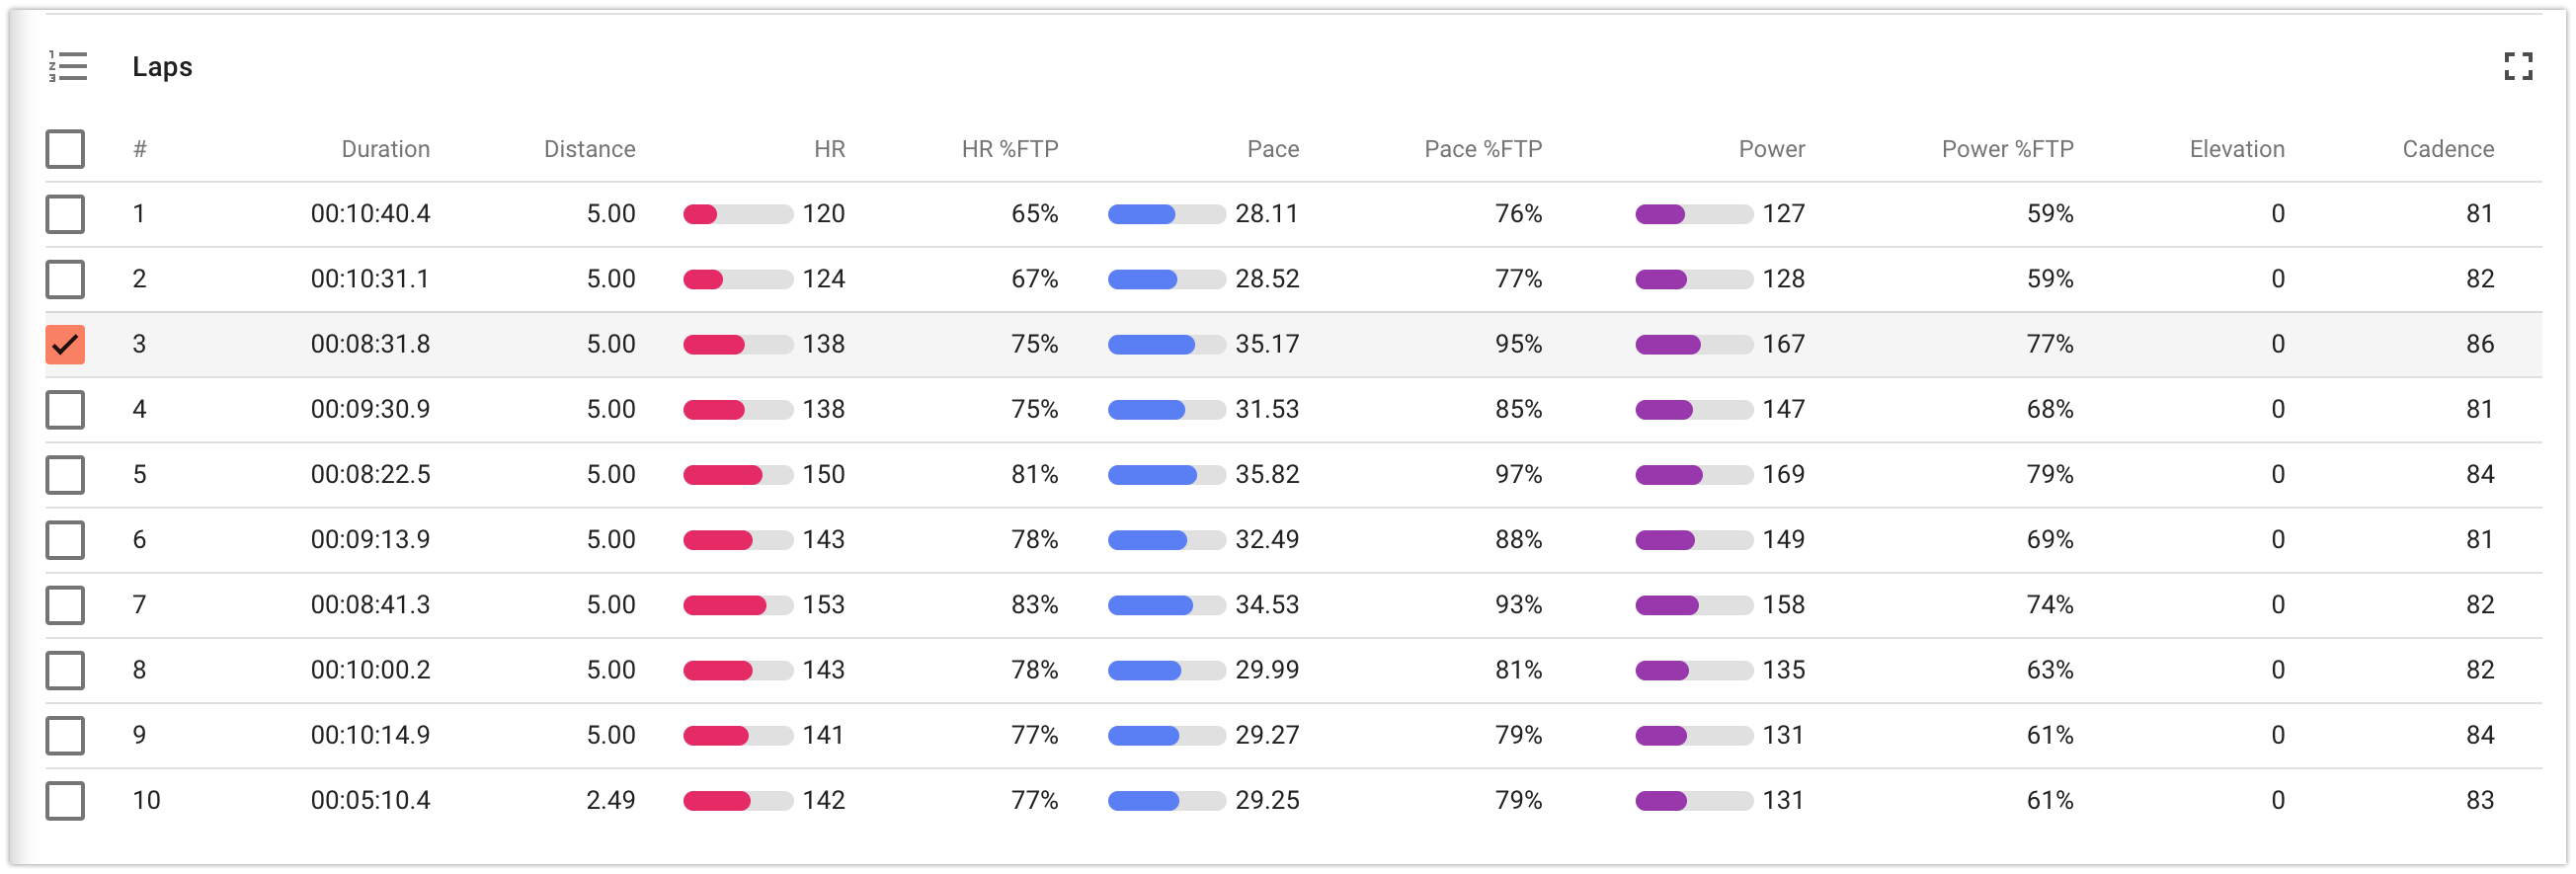
The selected lap is displayed on the chart and on the map, and information about its calculated indicators and peaks is provided on the “Details” tab.
Time in zones
The "Zones" tab displays the activity duration in each zone, for each intensity indicator.
You can set up the training zones limits in the section "Settings” - “Zones”
Analysis of a structured activity completion, by segments
For a structured activity, planned by segments, there are the following additional analysis options available:
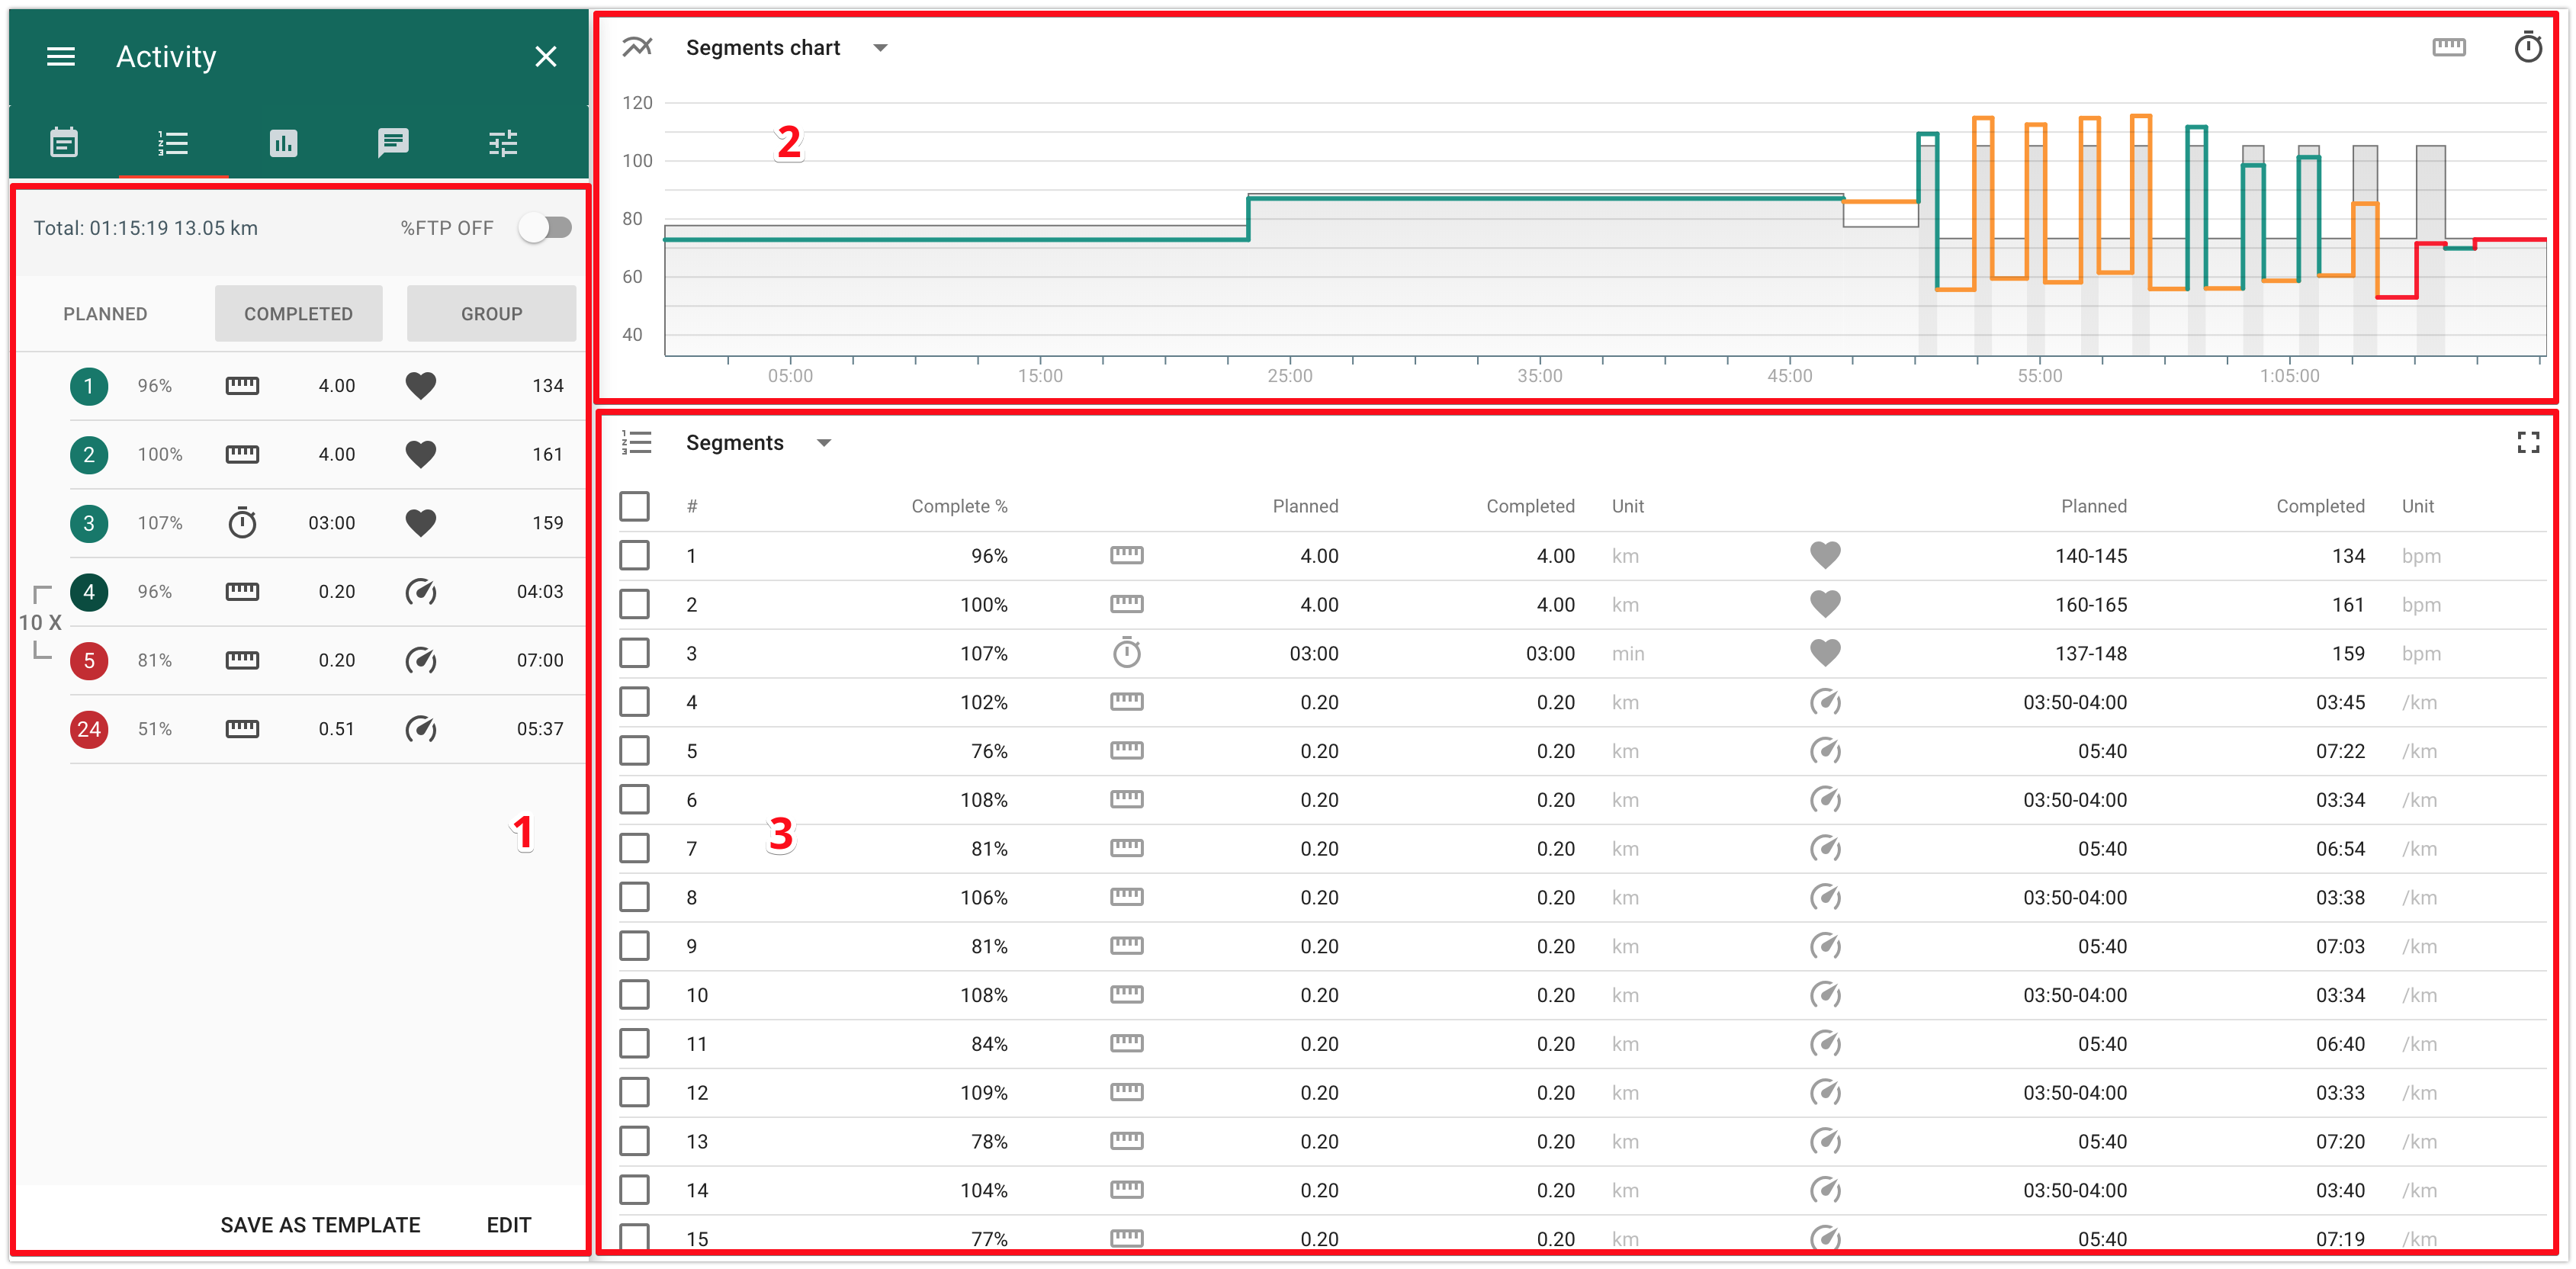
- 1 - panel of the total values by segments.
It allows to choose a display mode “Planned” / “Completed” / “Groups”:
- Planned - planned values by segments;
- Completed - actual values by segments.
- Groups - allows to manage the mode of data display: per each segment or per group of segments.
- 2 - chart of planned/actual values by segments
The x-axis is the total duration/distance of the activity, the y-axis - % LT for the intensity indicator set in the planned activity (heart rate, pace, power).
The color of the line reflects the segment's percent of completion:
- green - deviation from the plan does not exceed 10%;
- yellow - deviation from the plan is from 10% to 20%;
- red - deviation from the plan is more than 20%.
3 - table of planned/actual values by segments.
When you select any segment in the table, then on the “Details” tab located to the left you will find indicators and peaks for the given segment.
Indicators in the completed activity that are calculated by Staminity
Staminity calculates a set of indicators as for the whole activity, as for a lap, segment or any part of the activity selected on the chart, based on the initial data registered by sports watch or by an application on the smartphone.
The information is displayed on the “Details” tab in activity and includes the following indicators:
- Distance
- Duration
- Cadence
- Elevation gain and loss
- Grade
- Average HR
- Calories
- Intensity level
- Training load
- VAM
- Relative power
- Average power and adjusted power
- Average pace and adjusted pace
- Variability index
- Decoupling and efficiency factor
Distance
Length of an activity, lap, segment or any interval:
- in kilometers or miles for running, cycling, skiing;
- in meters or yards - for swimming.
Duration
Staminity calculates three indicators of activity duration:
- Elapsed duration - time spent on activity from the beginning till the end. For example, if you started your activity at 9 a.m., then paused recording, by clicking on “Pause” for 10 minutes from 10 a.m. till 10:10 and finished activity at 10:30 then the “Elapsed time” will be 90 minutes.
- Duration - time spent on activity minus pauses. For the above-mentioned example, it will be 80 minutes.
- Moving duration - the number of seconds when the athlete moved during the activity. For the above-mentioned example, if during these 80 minutes an athlete twice stopped at the traffic light for 1 minute, without pausing his watch, then the moving duration will be 78 minutes.
Cadence
Cadence - step frequency in running, pedaling speed in cycling, stroke frequency in swimming, etc. Is measured by the number of steps/turns/strokes per minute.
Elevation gain and loss
An altitude above sea level is registered for each activity that was recorded by a device. It is done with the help of a built-in barometer (more accurately) or data received from GPS/Glonass satellites (less accurately). Based on this information, the following indicators are calculated in Staminity:
- Elevation - sum of the elevation gain and loss;
- Elevation gain - sum of positive elevation differences of adjacent points;
- Elevation loss - sum of negative elevation differences of adjacent points
We are constantly upgrading the calculation algorithm in order to avoid incorrect registration of altitude by the device at separate points.
Grade
Slope grade of the selected part of an activity. It is calculated in the following way:
Grade = elevation / distance.
Calories
When calculating the amount of energy spent during activity, the duration and intensity of the activity, as well as gender, age, weight of an athlete stated in the application settings, are taken into account.
For men: kcal= [Duration] x [(-55.0969 + 0.6309 x HR + 0.1988 x weight + 0.2017 x age) / 4.184]
For women: kcal= [Duration] x [(-20.4022 + 0.4472 x HR - 0.1263 x weight + 0.074 x age) / 4.184], where:
- Duration - activity duration in minutes,
- HR - average heart rate,
- Weight - weight in kilograms,
- Age - athlete’s age.
If an athlete hasn’t set gender, height, and weight in settings, then the calculation is performed for a 30 years old man who weighs 70 kg.
Sources:
- Braydenwm.com: Calories and Power as a Function of Heart Rate (http://www.braydenwm.com/calburn.htm)
- Journal of Sports Sciences: Prediction of Energy Expenditure (http://www.braydenwm.com/cal_vs_hr_ref_paper.pdf)
Intensity level
The intensity level of an activity is measured in % of the athlete’s LT level by power, pace or heart rate.
If the activity has been completed with the use of a power meter, then
Intensity level = Adjusted power / LT by power.
If power hasn't been registered during the activity, then the calculation is made based on the pace value:
Intensity level = Adjusted pace / LT by pace
If there are no power and pace values registered (for example, during strength training in a gym), then the calculation is made based on the heart rate value:
Intensity level = Average HR / LT by heart rate.
TL - Training load
Training load is calculated based on the intensity level of the activity and its duration. The load of 100 points corresponds to an activity that lasted 1 hour and was completed at the LT level by power (for cycling), by pace (for swimming and running) or by heart rate (for all sports).
Training load = Intensity level * Duration in hours * 100
VAM
VAM - is an abbreviation for the Italian velocità ascensionale media, which translates into English as "average ascent speed". This term has been proposed by the Italian physiologist and cycling coach Michele Ferrari. The indicator is calculated for any selected part of the distance and shows the speed in meters per hour.
VAM is widely used in cycling when it is needed to compare the athletes' fitness and to calculate the relative power.
VAM = Elevation gain / Duration in hours.
Source: https://en.wikipedia.org/wiki/VAM_(bicycling)
Relative power
Relative power - a calculated indicator showing power in watts per kilogram. This is one of the most important indicators for cyclists.
Relative power is calculated based on the VAM according to the following formula:
Relative power (W/kg) = VAM (m/hour) / (Gradient factor x 100),
where Gradient factor = 2 + (Grade in percents / 10).
For example, for grade of 6%, gradient factor will be 2,6 and for grade of 11% - 3,1.
Source: https://en.wikipedia.org/wiki/VAM_(bicycling)
Average power and adjusted power
For an activity completed with the use of a power meter an average power and adjusted power can be calculated.
Average power - an arithmetic mean of the power values registered at each point of the activity or of its interval.
Adjusted power indicates an equivalent of the average power for an activity/interval of the same duration, provided that the athlete applied efforts evenly.
The use of the adjusted power.
Two activities of the same duration and of the same average power values can require different efforts from the athlete: an activity intended to develop aerobic endurance completed on the same intensity level will require fewer efforts than an activity intended to develop speed, consisting of several accelerations with recovery intervals.
When calculating the adjusted power, smoothing of the power values registered by the power meter at each point of the activity is being applied.
When developing an algorithm of the adjusted power calculation in Staminity, the following sources have been used: Training and Racing with a Power Meter by Hunter Allen, Andrew Coggan; F.Skiba's works on quantitative assessment of the intensity of the cyclists', runners' and triathletes' trainings.
Average pace and adjusted pace
Average pace is calculated for an activity or any selected interval of the activity as the distance of the interval divided by its duration.
However, the pace of the activity depends greatly on the type of the route: an activity completed on a track cannot be compared with an activity completed on a hilly terrain.
The adjusted pace indicator has been introduced in order to enable comparison of the activities completed on the routes with different terrain.
Adjusted pace - a calculated pace with which an athlete would run an activity of a similar duration on a track, with the same efforts as in the initial activity/interval.
When developing an algorythm of the adjucted pace calculation in Staminity, the following sources have been used: works of C.T.M Davies (1973 year), works of Alberto Minetti (2003 years), article by R.Lovett for Runnersworld (2007 year).
We are constantly working on the upgrade of the adjusted pace calculation algorithm.
Variability index
Variability index is calculated for the activities with power indicators and shows how evenly an athlete applied efforts during the entire activity.
Variability index = Adjucted power / Average power
Decoupling and efficiency factor
Decoupling is an ability of the heart rate to increase during the activity even if the power and pace remain at the same level. An aerobically trained athlete will have the minimum increase of the heart rate.
The decoupling value is reflected by the change in the value of the indicator "Pace:HR" or "Power:HR" for 1 and 2 half of the activity in percents. The indicator "Pace:HR" and "Power:HR" is called efficiency factor.
Joe Friel in the The Triathlete's Training Bible gives the following assessment criterion of the decoupling value:
"If change of the value of the indicator "pace by HR" (or "power by HR") is less than 5%, then the exercise is considered as "correlated". In this case physical training with a view to the aerobic threshold for a race of a given duration ... can be considered to be fully completed".
In Staminity calculation of the efficiency factor, as well as of the decoupling, can be performed both for a whole activity, and for the selected interval.
Efficiency factor
Efficiency factor (EF) = Average pace / Average HR,
and for the activities with the power meter:
Efficiency factor (EF) = Average power / Average HR.
Pace:HR - decoupling (pace)
Decoupling (pace) shows the change in the efficiency factor's value, calculated based on pace for the first and the second half of the activity:
EF1 = Average pace / average HR for the 1 half of the activity
EF2 = Average pace / average HR for the 2 half of the activity
Pace:HR = (EF1 - EF2) / EF1
Power:HR - decoupling (power)
Decoupling (power) shows the change in the efficiency factor's value, calculated based on power for the first and the second half of the activity:
EF1 = Average power/ average HR for the 1 half of the activity
EF2 = Average power/ average HR for the 2 half of the activity
Power:HR = (EF1 - EF2) / EF1